Thanks to Glen Alleman for this guest blog
A recent post at PM Hut describes the process of capturing 3-Point estimates for schedule. This is an example of Yogi's quote ian action
In theory there is no difference between theory and practice. In practice there is. - Yogi Berra
While it may be appropriate in the classroom to teach about the 3 point estimate process - minimum, most likely, and maximum - it is not appropriate in practice. This does not mean there are not gobs of people out there doing this. It doesn't matter how many people teach this, how often it is said, it's simply not good practice.
Here's why:
- If you ask someone to estimate how long something will take by having them think about the Most Likely duration, they will for the most part actually think about the "average" duration. The most likely duration is the value that appears most often if you were to ask a group of people the same question. The Most Likely is the Mode of the samples of that question. It is the value that occurs most often.
- Now when you ask someone the estimate what the least value the duration might be. Or ask them what the most value the duration might be, you'll get statistically significant different values, depending on the order you ask that question. This understanding has been developed by many organizations ranging from the US Navy to petroleum engineers estimating the contents of gas reserves.
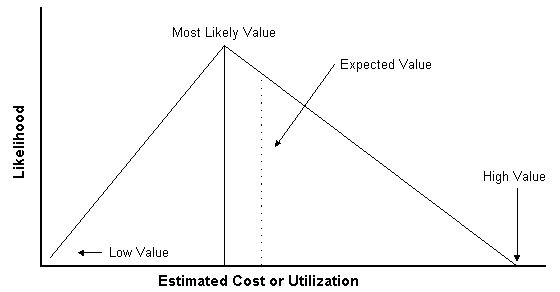
Here's a reminder of how to talk about the three values in our probability distribution.)
Figure 1: A Three Point Estimate Probability Distribution
So What's the Point Here?
Do not, I repeat Do Not ask for 3 point estimates of duration and cost. Instead as for "variances" of the probability distribution around the Most Likely number. Worse case ask for variances around the Mean (the average). But care must be taken for the measure of the Mean. Since the mean is a value formed by adding all the possible measures, it itself is subject to variance. Most Likely - the Mode - is a simple counting of the most recurring observed value - it is ordinal.
Why Is This Important?
When you ask for the Most Likely, High and Low, you can get up to 27% estimating bias on the estimates. This bias can be favorable or unfavorable. No matter, it is a bias.
The way to do this for duration and cost is to construct a variance ranking processes. Here's a sample table.
Figure 2: Risk Classification Levels
| Classification | Uncertainty | Overrun | |
| A | Routine, been done before | Low | 0 - 2% |
| B | Routine, but possible difficulties | Medium to Low | 2 - 5% |
| C | Development, with little technical difficulty | Medium | 5 - 10% |
| D | Development, with sometechnical difficulty | Medium High | 10 - 15% |
| E | Significant effort, technical challenge | High | 15 - 25% |
| F | No experience in this area | Very High | 25 - 50% |
Now there are several important things about this table:
- The risk level classification is not a number, it is a letter. This avoids the natural tendency to do arithmetic on the risk ranking. This is a common failure mode for anyone using the PMI style risk management. Take the probability of occurrence and multiply it by the consequential outcome to get a risk rank. NOT.
Both the probability of occurrence and the consequential outcomes are probability distributions, represented by integral equations. Multiplication is not an operator on integral equations - except in their Laplace Transform representations.
- The descriptions of the risk classification represent the operational aspects of the project for a specific technology or process. This means that the words in the classification column can change depending on the problem domain. For manned space flight a Risk Classification D, may have different words, and certai9ntly have different variance ranges than a risk variance D for an Oracle ERP system roll out.
What we need is a table like this for every major risk category.
A similar table can be built for the consequential outcomes. Then and ONLY then can the risk matrix be constructed.
The final advise is risk ranking in terms of variance should be geometric.
Figure 3: Ranking Risk in terms of Variance
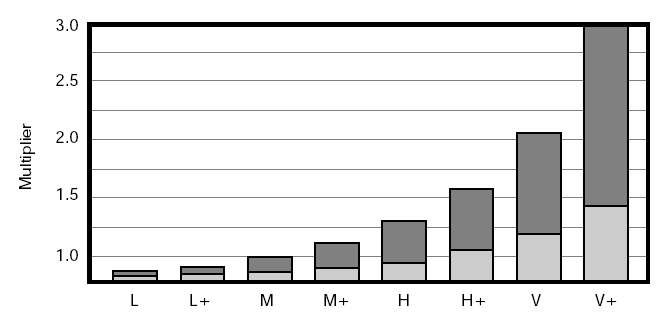
The reason you want to do this is that the separation of differences is not linear, it needs to be geometric. The scale 1, 2, 3, 4, 5 means that the difference between 1 and 2 is 100%. The difference between 4 and 5, is 20%.
Here's a Live Example
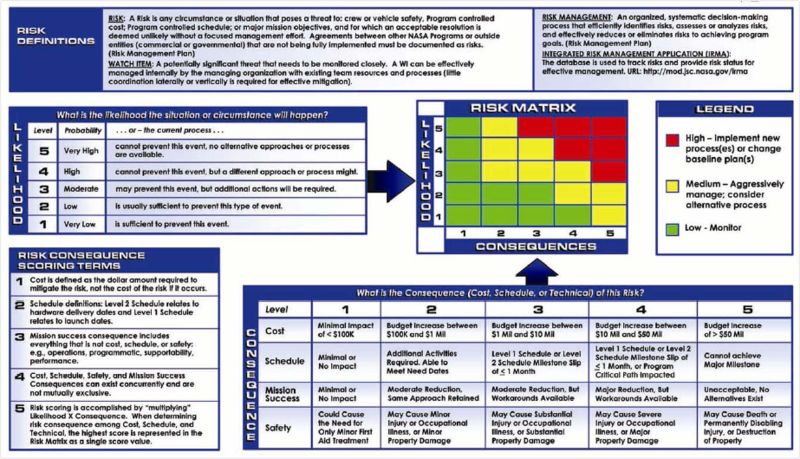
Connecting the dots - from NOT doing three point estimates - to doing probabilist impacts for the probability of occurrence and the consequential outcomes is shown in the picture below.
Figure 4: Probabilist Impacts
So:
- No three point measures asked to the engineers - only variance estimates for each class of risk
- No arithmetic between occurrence and impact
- Narratives of the measures (in the NASA example above they use numbers - not good - use letters)