I’ve met top estimators from lots of different walks of life. From professional gamblers, cost estimators, Price to Win practitioners and stock market analysts. I found the best ones all did these 3 things. Conversely, none of these things are prerequisites to producing estimates. The estimator who just collects bottom up estimates isn’t doing any of these. This is not just another common sense article. These are the 3 habits of highly effective estimators representing estimating best practice.
1. They know how & when to adjust source data
Top estimators question source data. When necessary they adjust it themselves. The best stock market analysts are especially good at this. Let’s say a company records seemingly good profits for 3 years. But then it makes massive write-downs in year 4 and records a loss. Most analysts would suspect the so-called profit years had been manipulated. The inevitable write-downs were building up all the time. They would adjust the recorded profit figures downwards before forecasting future profitability.
What about when the source data itself is a forecast? In Bids & Proposals we often need to take estimates from technical experts in our source data. What added value do top estimators bring to these situations? Research by Griffin, Dale & Ross (2002) found that individuals systematically under or over-estimate. Whilst they can get better with training; they will always have a bias. What’s really interesting is how consistent the bias is. We can even measure this using something called a Brier score. The implication is that we can actually adjust a person’s estimates by a predictable margin to dramatically improve the accuracy.
2. They approach the same task with multiple estimating techniques
When you watch a good murder mystery, it takes a combination of clues to find out who the murderer is. The detectives don’t go kicking down the of the first name they get from an informant. To finish the analogy; they are looking for a combination of an informant name, crime scene clue and motive.
Estimating is the same. If you just use one estimating method; you are exposing yourself to systematic errors. In our Price to Win methodology we use five different estimating techniques.
Below: Five different estimating techniques we use to do Price to Win
")
Let’s take the example of estimating the price of a Ford Mondeo. How much does a new Ford Mondeo cost?
- Comparative Analysis: A Ford Mondeo costs more than a Nissan Micra but less than a Jaguar XF. If it costs the same as a Jaguar XF, customers will chose the alternative. If it costs the same as the Nissan Micra, Ford won’t make any money.
- Parametric Analysis: The Ford Mondeo is a car for the middle classes. Therefore it must cost ~40% of the average annual household income. If it costs more, the average customer cannot afford it.
- Alternative Analysis: Michael Porter coined the term ‘substitute products’ as one of five major influences. Our Ford Mondeo provides transport which competes with public transport and remote working. There are limits on what people will pay for the convenience our car provides over public transport.
- Bottom Up Analysis: This says that a Ford Mondeo costs the sum of its parts plus a margin. We’d calculate the cost of four wheels, an engine, windows etc…
By using five independent techniques, we make sure that errors do not replicate themselves. The five methods should produce similar results. If one stands out from the other three, it normally contains an error. The first three methods should give us an answer in the range of £14,000 – £20,000 ($ 23,000 – $33,000). If I put a decimal point in the wrong place and value the wheels at 2,000 instead of 200. Then this method will stand out from the others like a red flag.
3. No single variable has more than a 5% impact on the total
In 1906, Francis Galton made a remarkable discovery at a livestock fair. There was a prize on offer to correctly guess the weight of an ox. 800 people entered, including several ‘experts’. Yet nobody got the correct answer of 1,198lbs. However, Galton discovered that the average of the 800 estimates was… 1,197lbs! The reason came later. Within a large enough sample, the individual errors cancel each other out (remember our Brier scores). In other words, just as many people over-estimate and under-estimate. Therefore, people’s mistakes were compensated for.
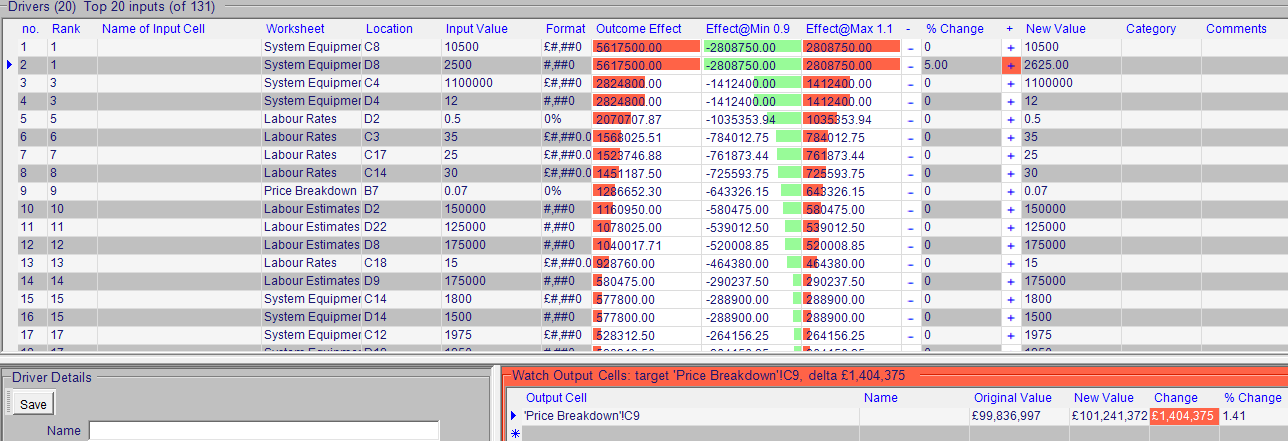
We can apply this to our own estimation challenges. We should make sure that our total is not overly influenced by one factor. Keeping each variable below 5% means that we have at least 20 inputs. At this level the extreme under-estimates should start to be countered by the extreme over-estimates. At Amplio, we use Arrisca to check the weighting of our estimates. It’s no good have 19 perfect estimates that account for 50% of your total; if 1 imperfect estimate makes up the other 50%.
Below: Arrisca reverse engineers excel spreadsheets to highlight risky assumptions