Thanks to Brian Tanner for this guest blog
Independent Cost Analyst Brian Tanner discusses trends in the costs of Offshore Patrol Vessels (OPVs)....
Firstly, what is an Offshore Patrol Vessel (OPV)? Many years ago in the late 1970s when the Island Class OPV were entering service a paper was written by the then Admiralty Experimental Works at Haslar defining the OPV as a ship of 75m to 85m minimum length with a speed of 20 to 24 knots. What was memorable was that the study initially perused wartime naval biographies noting that the degree of commentary on seakeeping depended on the class of frigate or destroyer. The ships’ characteristics were fed through a seakeeping computer programme, the results confirming the commentaries and led to the minimum size recommendation. The maximum speed was set by powering considerations, anything greater requiring a more sophisticated hull and significant increase in power, all of which would increase cost.
The term OPV can also be applied to larger ocean going vessels of the type in which case the ‘O’ stand for Ocean.
The armament of OPVs can vary greatly and for this Historical Trend Analysis they will be classified as follows:
- Type 1. Armed with a simple manually controlled light gun, typically 20mm to 40mm
- Type 2. Armed with a gun linked to a fire control system, typically 57mm to 76mm although some more sophisticated 40mm guns also fall into this category.
- Type 3. Armed with a simple manually controlled light gun and capable of hangaring a helicopter.
- Type 4. Armed with a gun linked to a fire control system and capable of hangaring a helicopter.
- Type 5. An Ocean going OPV, which is a larger version of Type 4.
An admission is required at the outset. Data, i.e. press cuttings and the like, on the first generation of OPVs was collected whilst in the Ministry of Defence pricing and forecasting group, and was left behind on retirement. Much of the data was hard copy public domain information and recorded in a spreadsheet which was copied on retirement. However, whilst physical characteristics can in most cases be confirmed, in a few cases the cost data has no demonstrable provenance as nothing is recorded on the internet.
Firstly, what is the trend in OPV size? There are various types of OPV so how to analysis the data? For each type of OPV there are few data points and those that do exist are somewhat scattered, so I chose to analyse the data set as a family of OPVs with qualitative independent variables for the various types. The independent variables selected after some experimentation were: Hangar for helicopter; gun > 40mm; ocean going. So the default is the simple first generation Type 1 OPV.
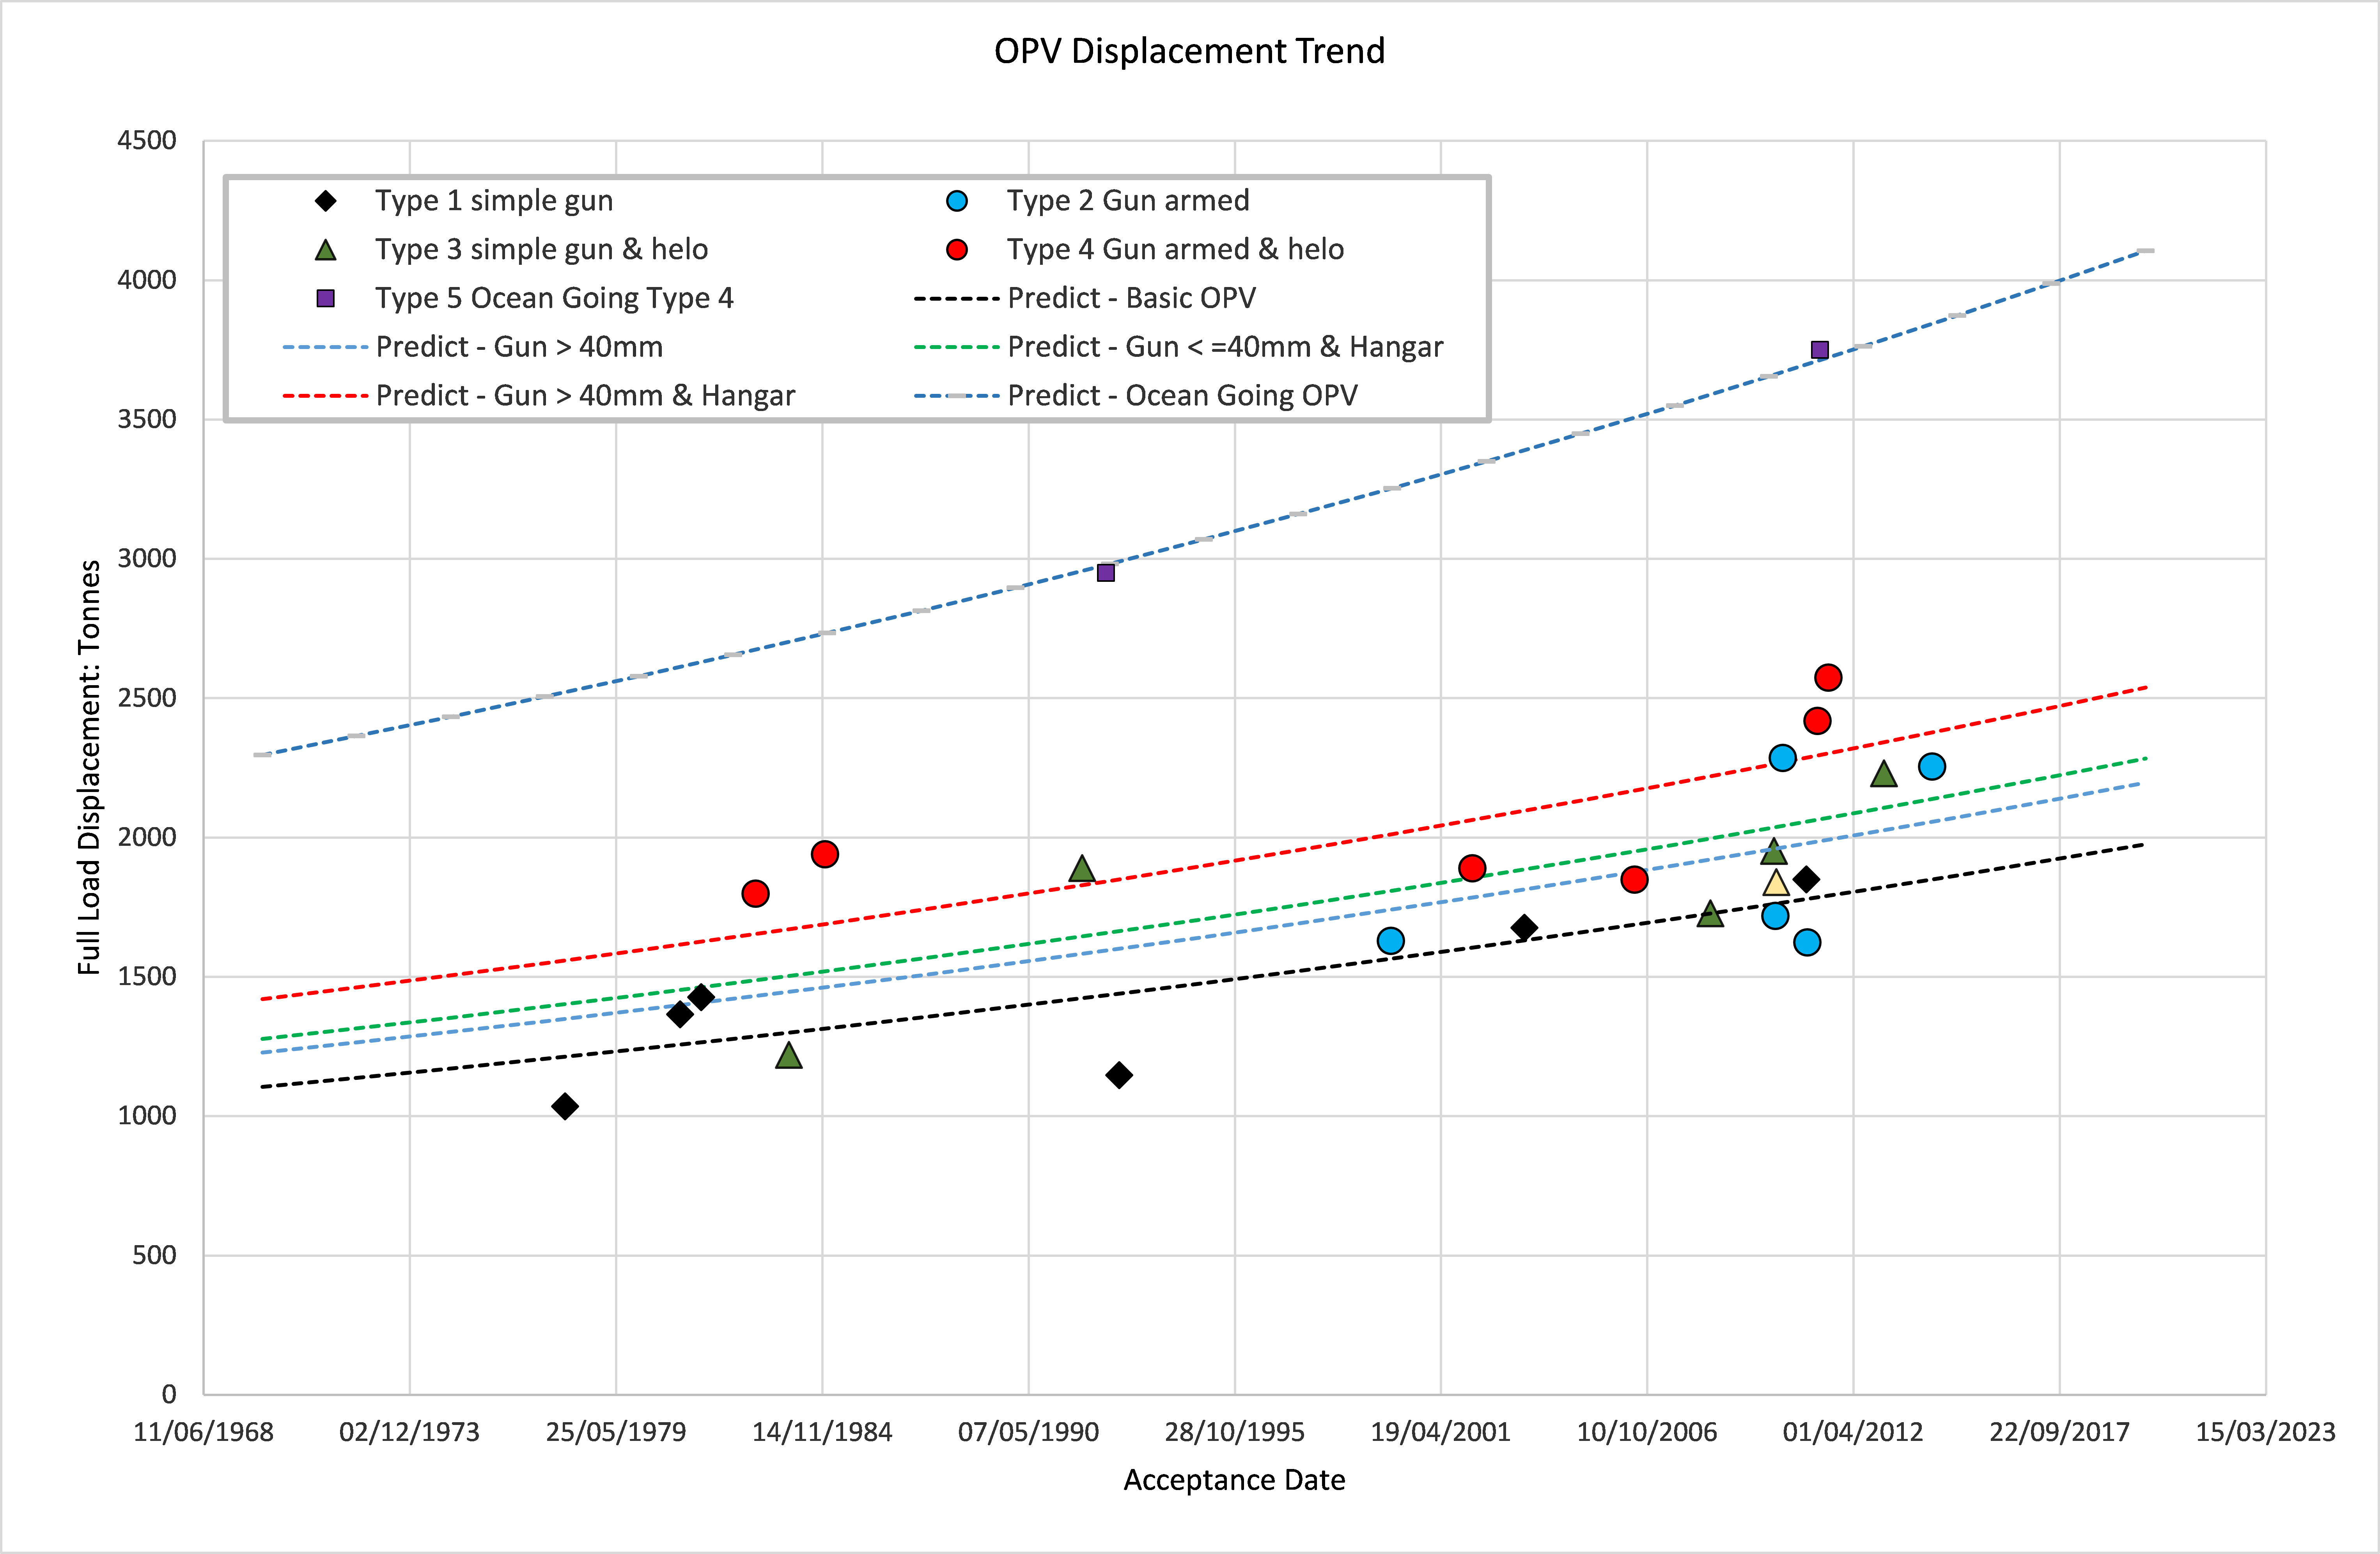
Figure 1 is a graph showing displacement against Acceptance Date for the various types of OPV for which data was obtained. Figure 2 shows the various types of OPV and the resulting trend lines, the chosen analysis showing a geometric growth rate slightly in excess of 1% per annum, or 12% per decade, with a variation of ± 25%.
Figure 1: Displacement v Acceptance Date
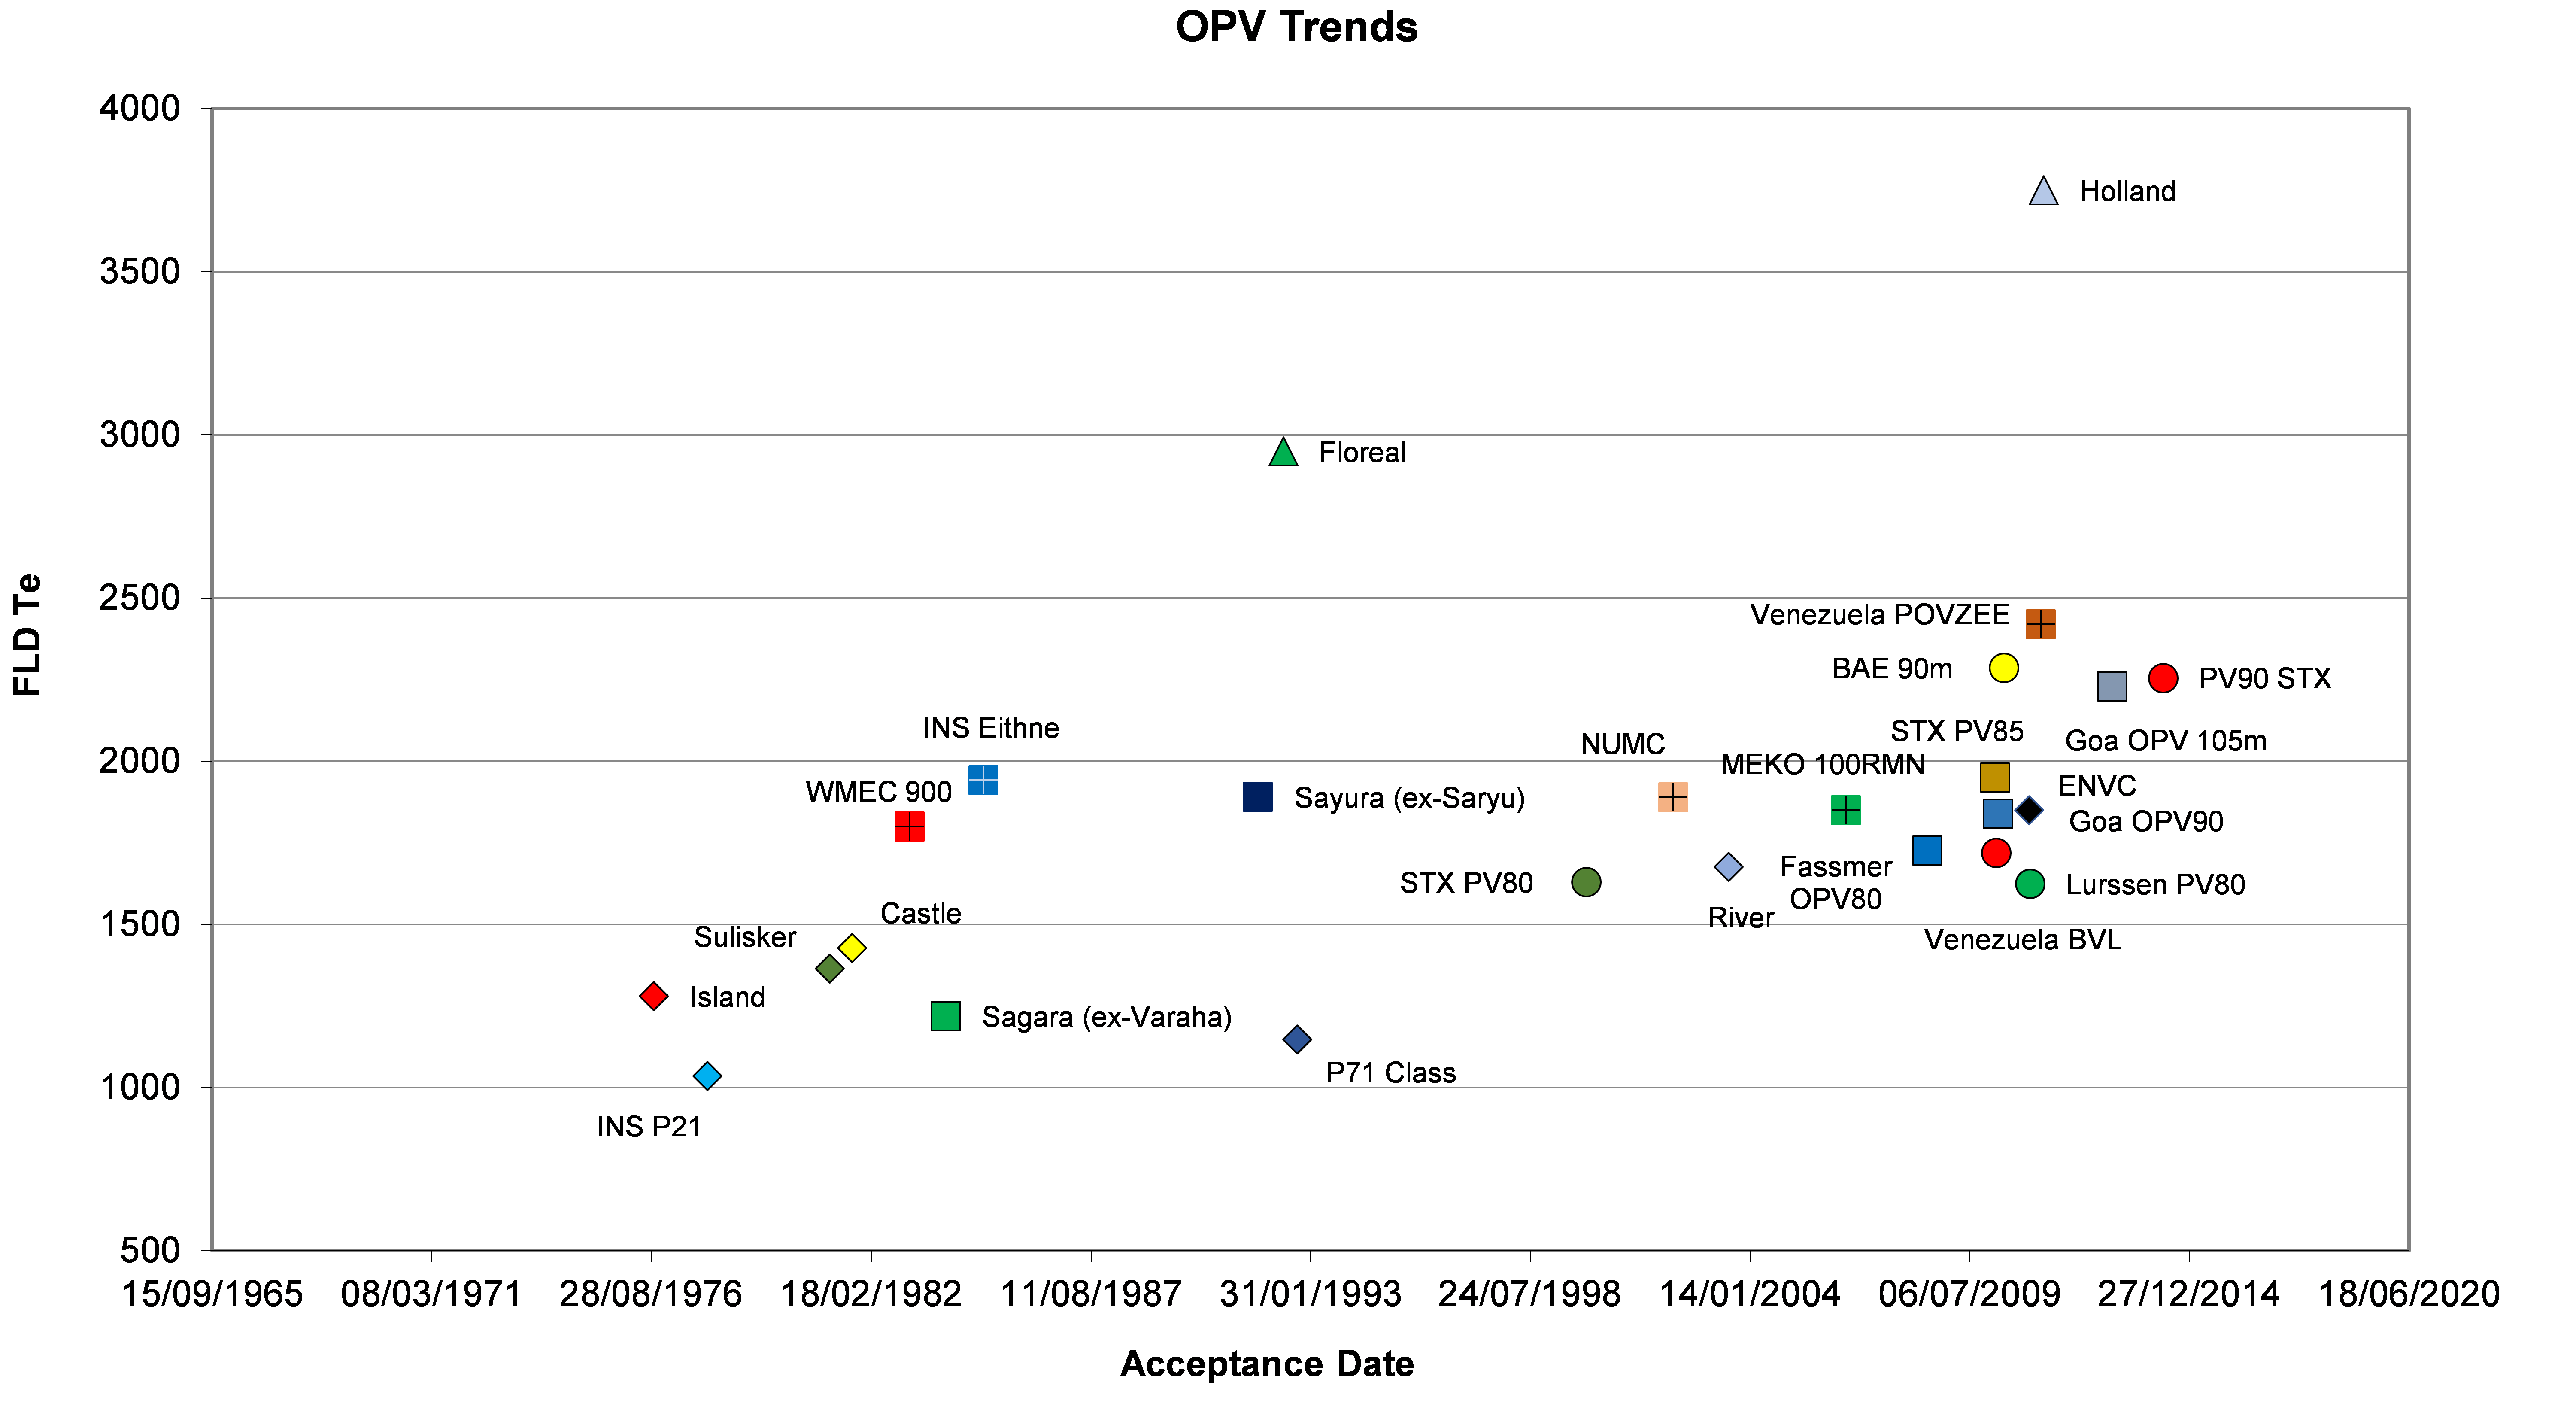
Figure 2: Displacement Trend Lines
And now to costs. These were normalised by the World Bank table of GDP deflators for most world nations and then converted into sterling using the 2014 average exchange rate. What was required for the analysis was weights – for specific costs – and dates – to fix the price base. Ideally the build or basic weight would give a true specific cost, but overall the only weight always available was Full Load Displacement. For dates, public domain information always has delivery dates but order dates quality varied so the year of order was used in the analysis.
Having defined OPV types at the outset the analysis found difficulty in categorising some OPVs while, due to the small data set, varying the category of one OPV significantly influenced the regression coefficients. After stepwise analyses it was found that just two variables: cost – shipbuild contract or project cost – and date gave good correlation.
In the course of the analysis some costs had to be considered as outliers and disregarded. Figure 3 is the plot of specific costs together with the regression lines:
Figure 3: Specific Cost Trend Lines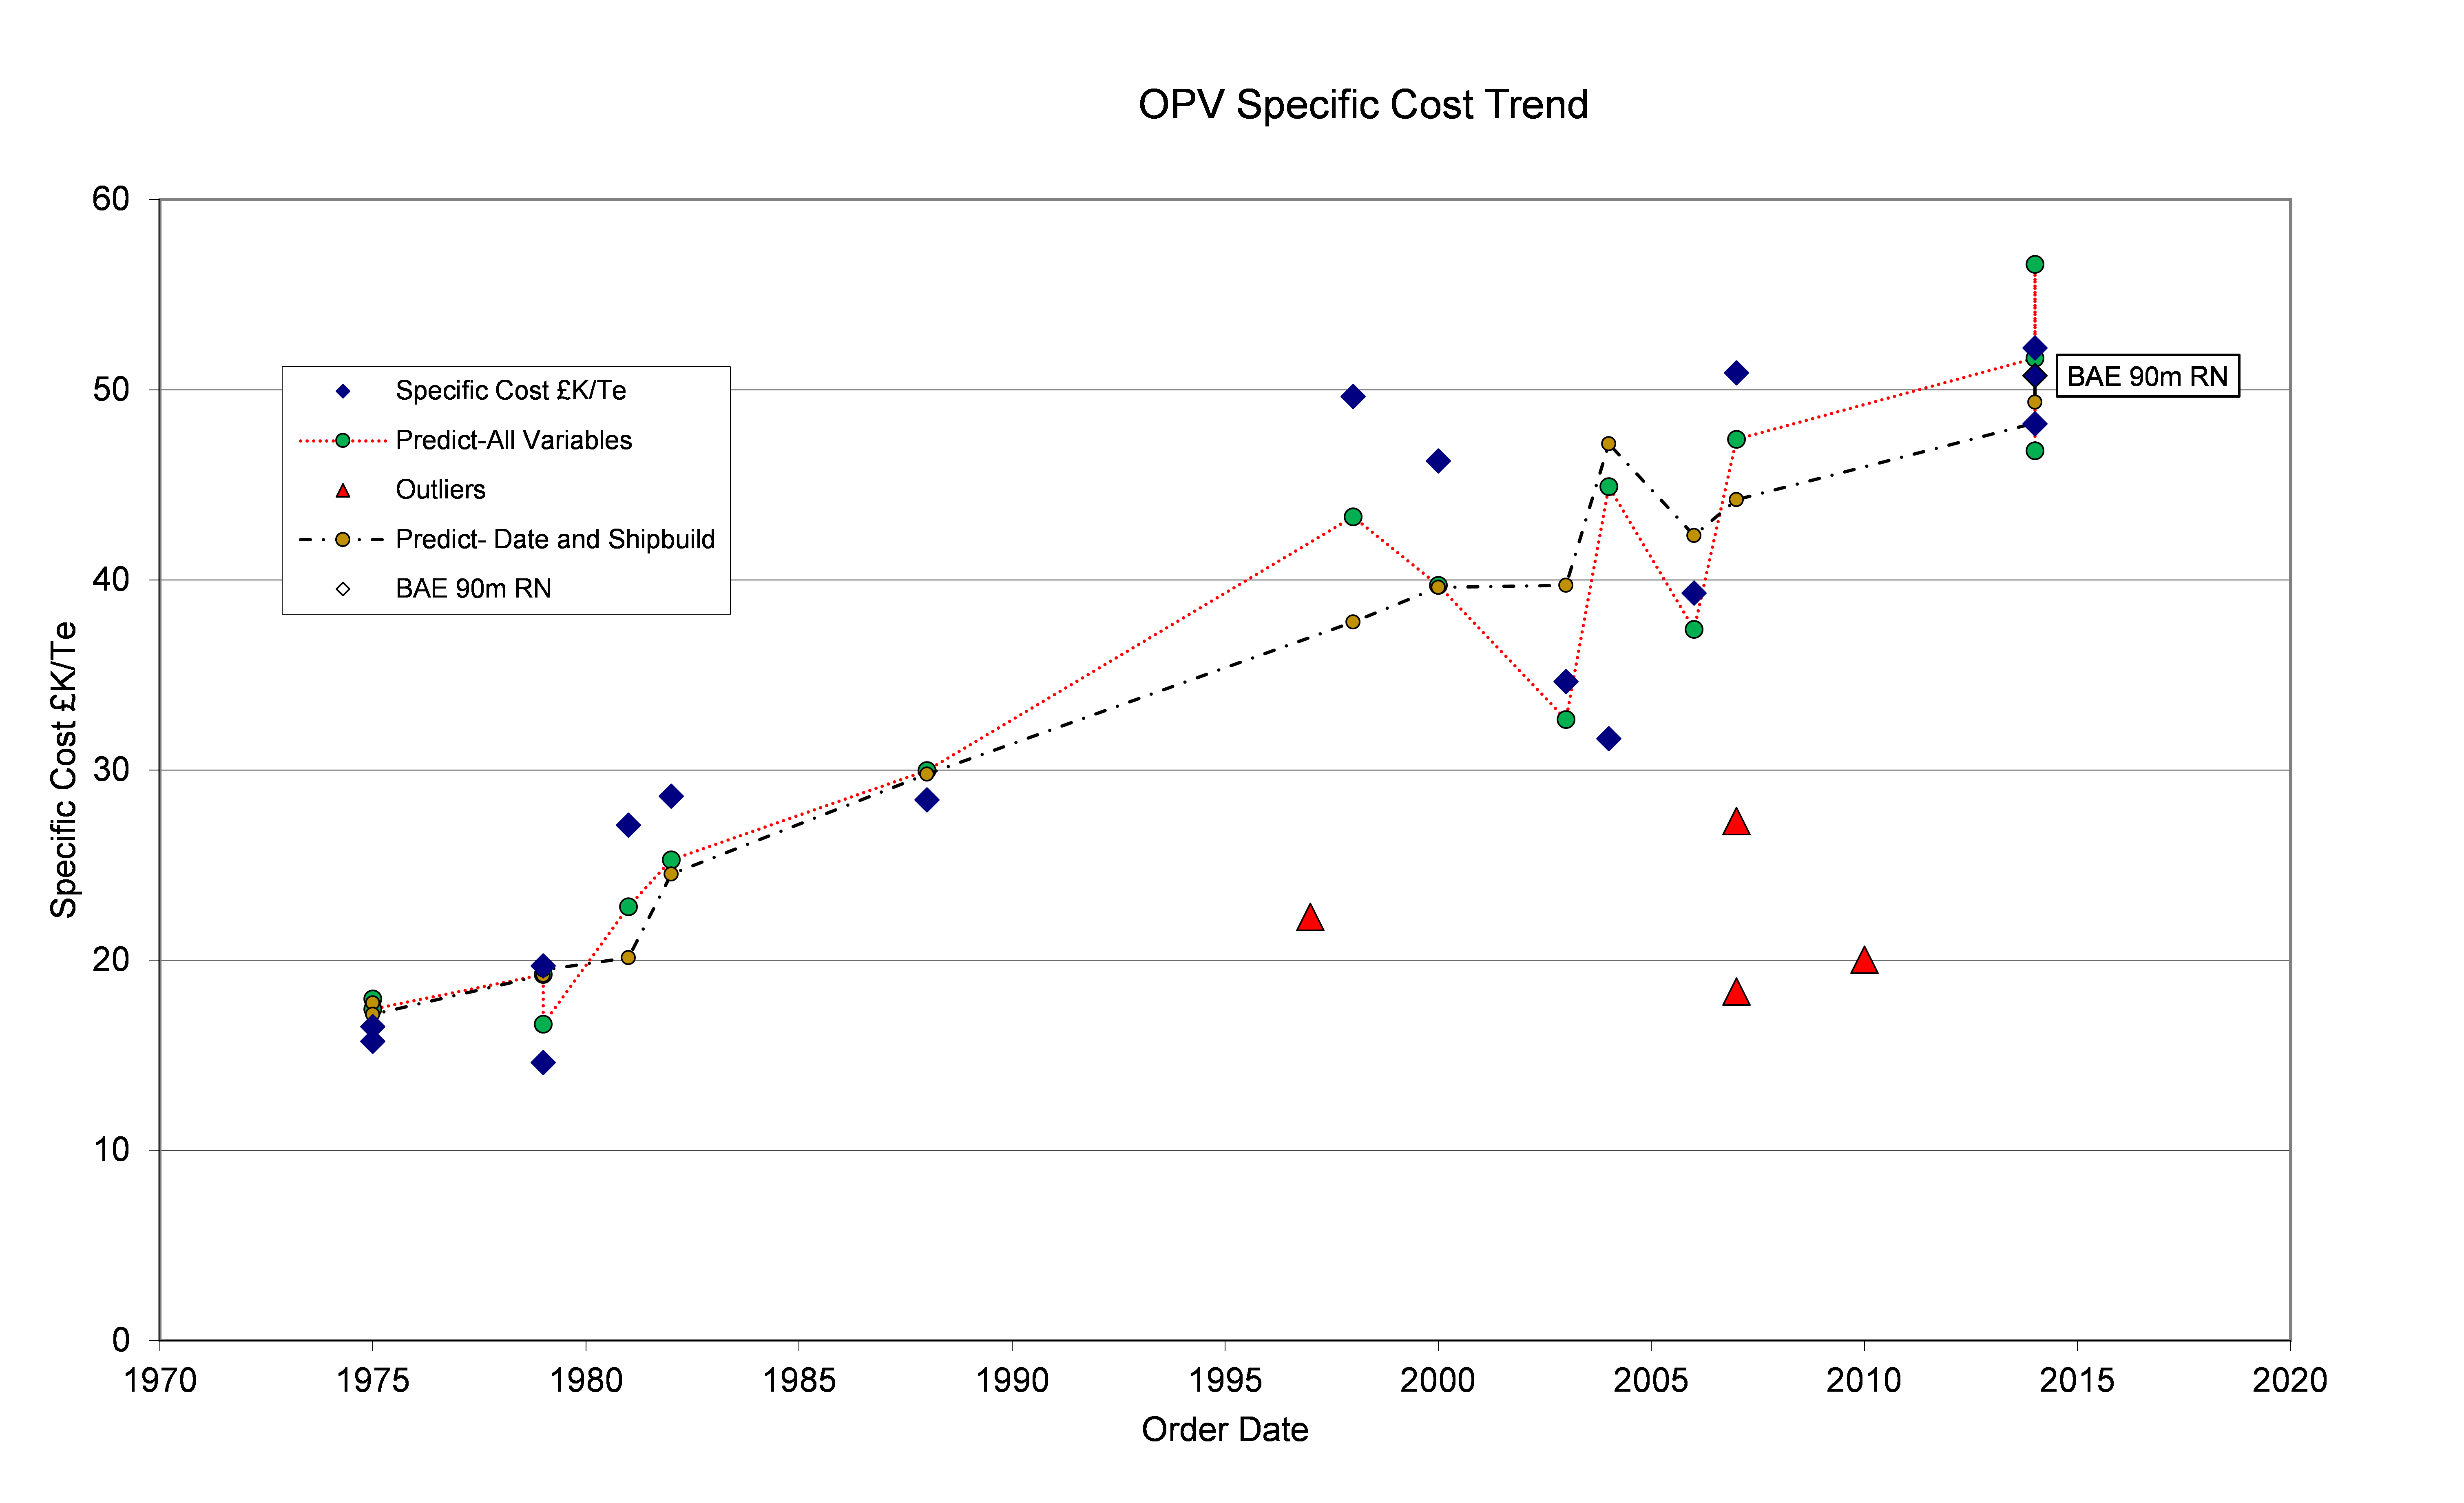
The trend lines demonstrate a real cost growth of 2.3% per annum with a cost spread of +40%, -15% and 2.6%per annum with a cost spread of +50%, -25%.
Looking more closely at the outliers and Royal Navy OPVs. Figure 4 is a plot of the specific costs leading to the following observations:
- Except for the Holland class OPV the outliers are the Irish Naval Service vessels built by Babcock Marine Appledore;
- While there has been much comment about the £348M paid for the River Class Batch 3 currently under construction for the Royal Navy, the reason given being the cost of skills retention, the specific costs demonstrate a 2.75% per annum real cost growth.
Figure 4: UK OPV Cost Trend
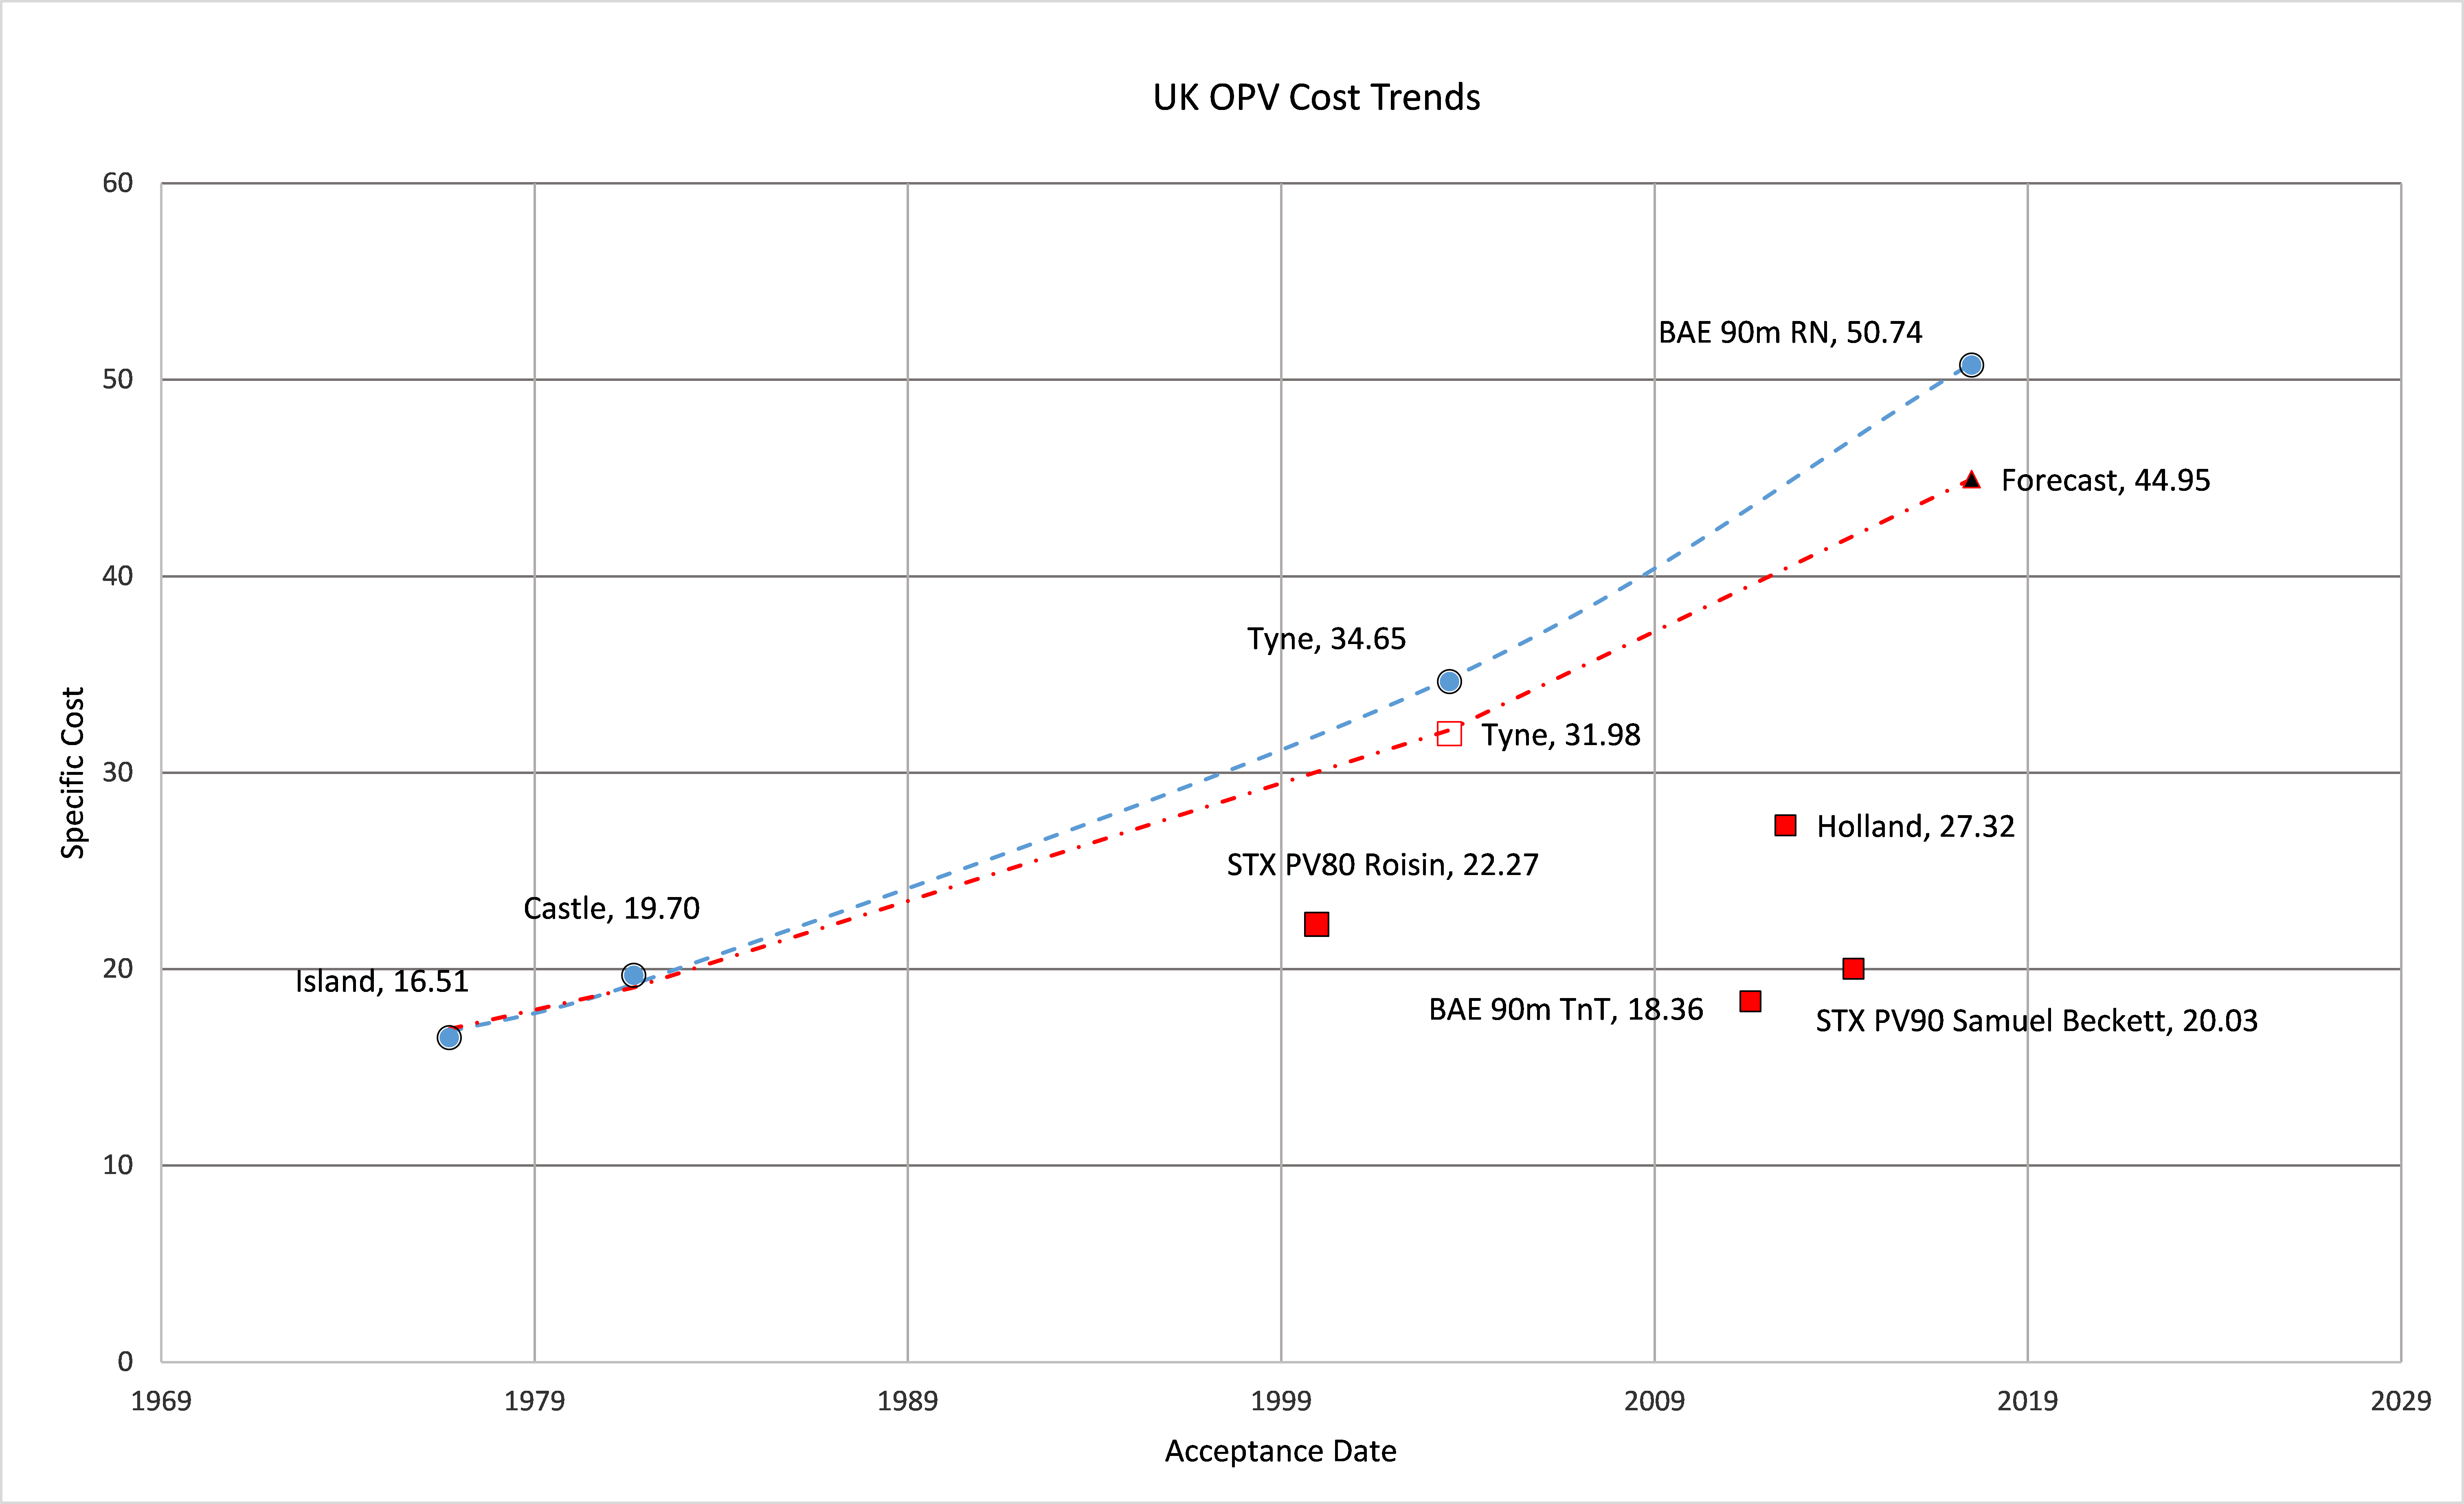
The real cost growth is obviously influenced by the data. That for the Island Class and Castle Class came from the published Navy estimates and are also available at Hansard HC Deb 23 October 1989 vol 158 cc358-61W . The River class were leased from BAE Systems in 2003 and purchased outright in 2012 for £39M. Production costs were estimated by assuming that the purchased cost reflected a 15% per annum declining balance depreciation. However, the resulting figure can be assumed to be the production cost of three vessels excluding or including the design cost. With design included the real cost growth is 2.4% which is similar to that from the overall analysis and the current construction of the Batch 3 River Class would be some one eighth greater than any projection.
Overall, OPVs come in several different types and the paucity of data has made analysis difficult. An overall analysis without quantitative factors for the various types provides a reasonable indication of the real cost growth. For any specific acquisition it may be that a near neighbour approach will offer the best comparator.