Thanks to Brian Tanner for this guest blog
Independent Cost Analyst Brian Tanner discusses Historic Trend Analysis (HTA) of ship build costs...
In the early 1990s the Ministry of Defence Director General Ships needed to identify the budget for some new survey ships. Cost records for previous vessels were not held so recourse was made to the pre internet public domain, i.e. industry publications. It was found that prices were published when an order was announced while typically two years later an article appeared describing the vessel on the occasion of its sea trials or delivery. The article usually contained the top level ship characteristics. Liaison with the then Department of Trade and Industry Shipbuilding Task Force provided the actual prices for the vessels; these did not vary significantly from the published prices.
The vessels for which data was collected were ordered for: Scottish Fisheries Protection Agency; DEFRA, Trinity House, NERC and Northern Lighthouse Board. The application of regression techniques using quantitative and qualitative factors as listed below allowed a sufficient parametric equation to be identified to forecast the required budget.
- Size = Volume (Gross Tonnage); Mass (Build Weight, Displacement)
- Crew Numbers = Number - measure of outfitting
- Laboratories / Workshops = Factor ^ 0/1
- Speed > 20 to 22 Knots major cost factor
- Year of Build = Complexity trend
The resultant parametric equation was:
Cost = A x Gross Tonnage 0.567 x Crew Numbers 0.26 x (Labs) 1.31 0/1 x Date 0.69
Note the GT exponential of 0.567. The end result was the acquisition of the survey ships HMS Echo and Enterprise.
The data set was maintained and updated as it was expected that a third vessel would be required when HMS Roebuck decommissioned. In the event this did not happen.
Figure 1: Comparison of THV Galatea, THV Alert and NLV Pharos
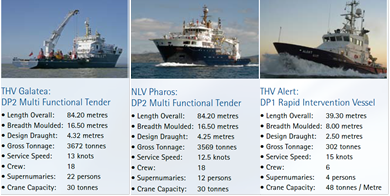
In more recent times, employment in estimator training led to the survey ship data being further updated with public domain information to provide both examples and training exercises Trinity House together with the Northern Lights Board had jointly procured from Stocznia Remontowa SA, Gdańsk, Poland the three vessels shown here. The total cost was published and a search of Trinity House annual reports produced the individual prices for THV Galatea and THV Alert and hence NLV Pharos. Students were given the total cost and exchange rate at the time of order together with the data shown here and tasked to estimate the costs for the individual vessels. The model answer is shown below.
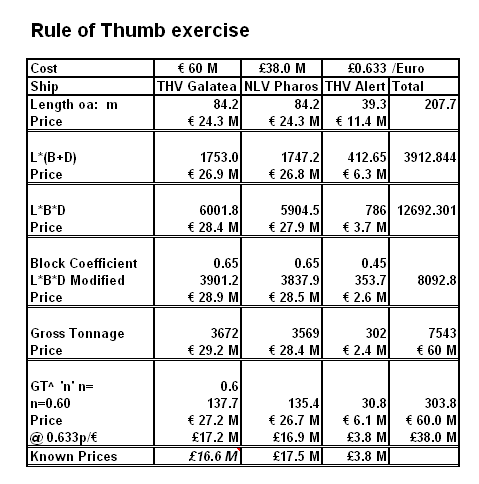
The nearest estimate for the published costs used Gross Tonnage with a 0.6 exponent. This is an example of Chilton’s Law which is based on the observation that the cost of an object is less than proportional to its size. The exponent can range in value between 0.5 and 1, typical values being of the order of 0.6/ 0.7.
A simple example is the cost of a hollow sphere. Presuming the cost is based on the area of metal required to fabricate the sphere then cost can be shown to be a function of Vol 0.67.
In the Rule of Thumb exercise there is an estimate close to that of gross tonnage with an 0.6 exponential and that is one based on the parameter L*(B+D), that is, the area of the box surrounding the hull, which is another representation of Vol 0.67.
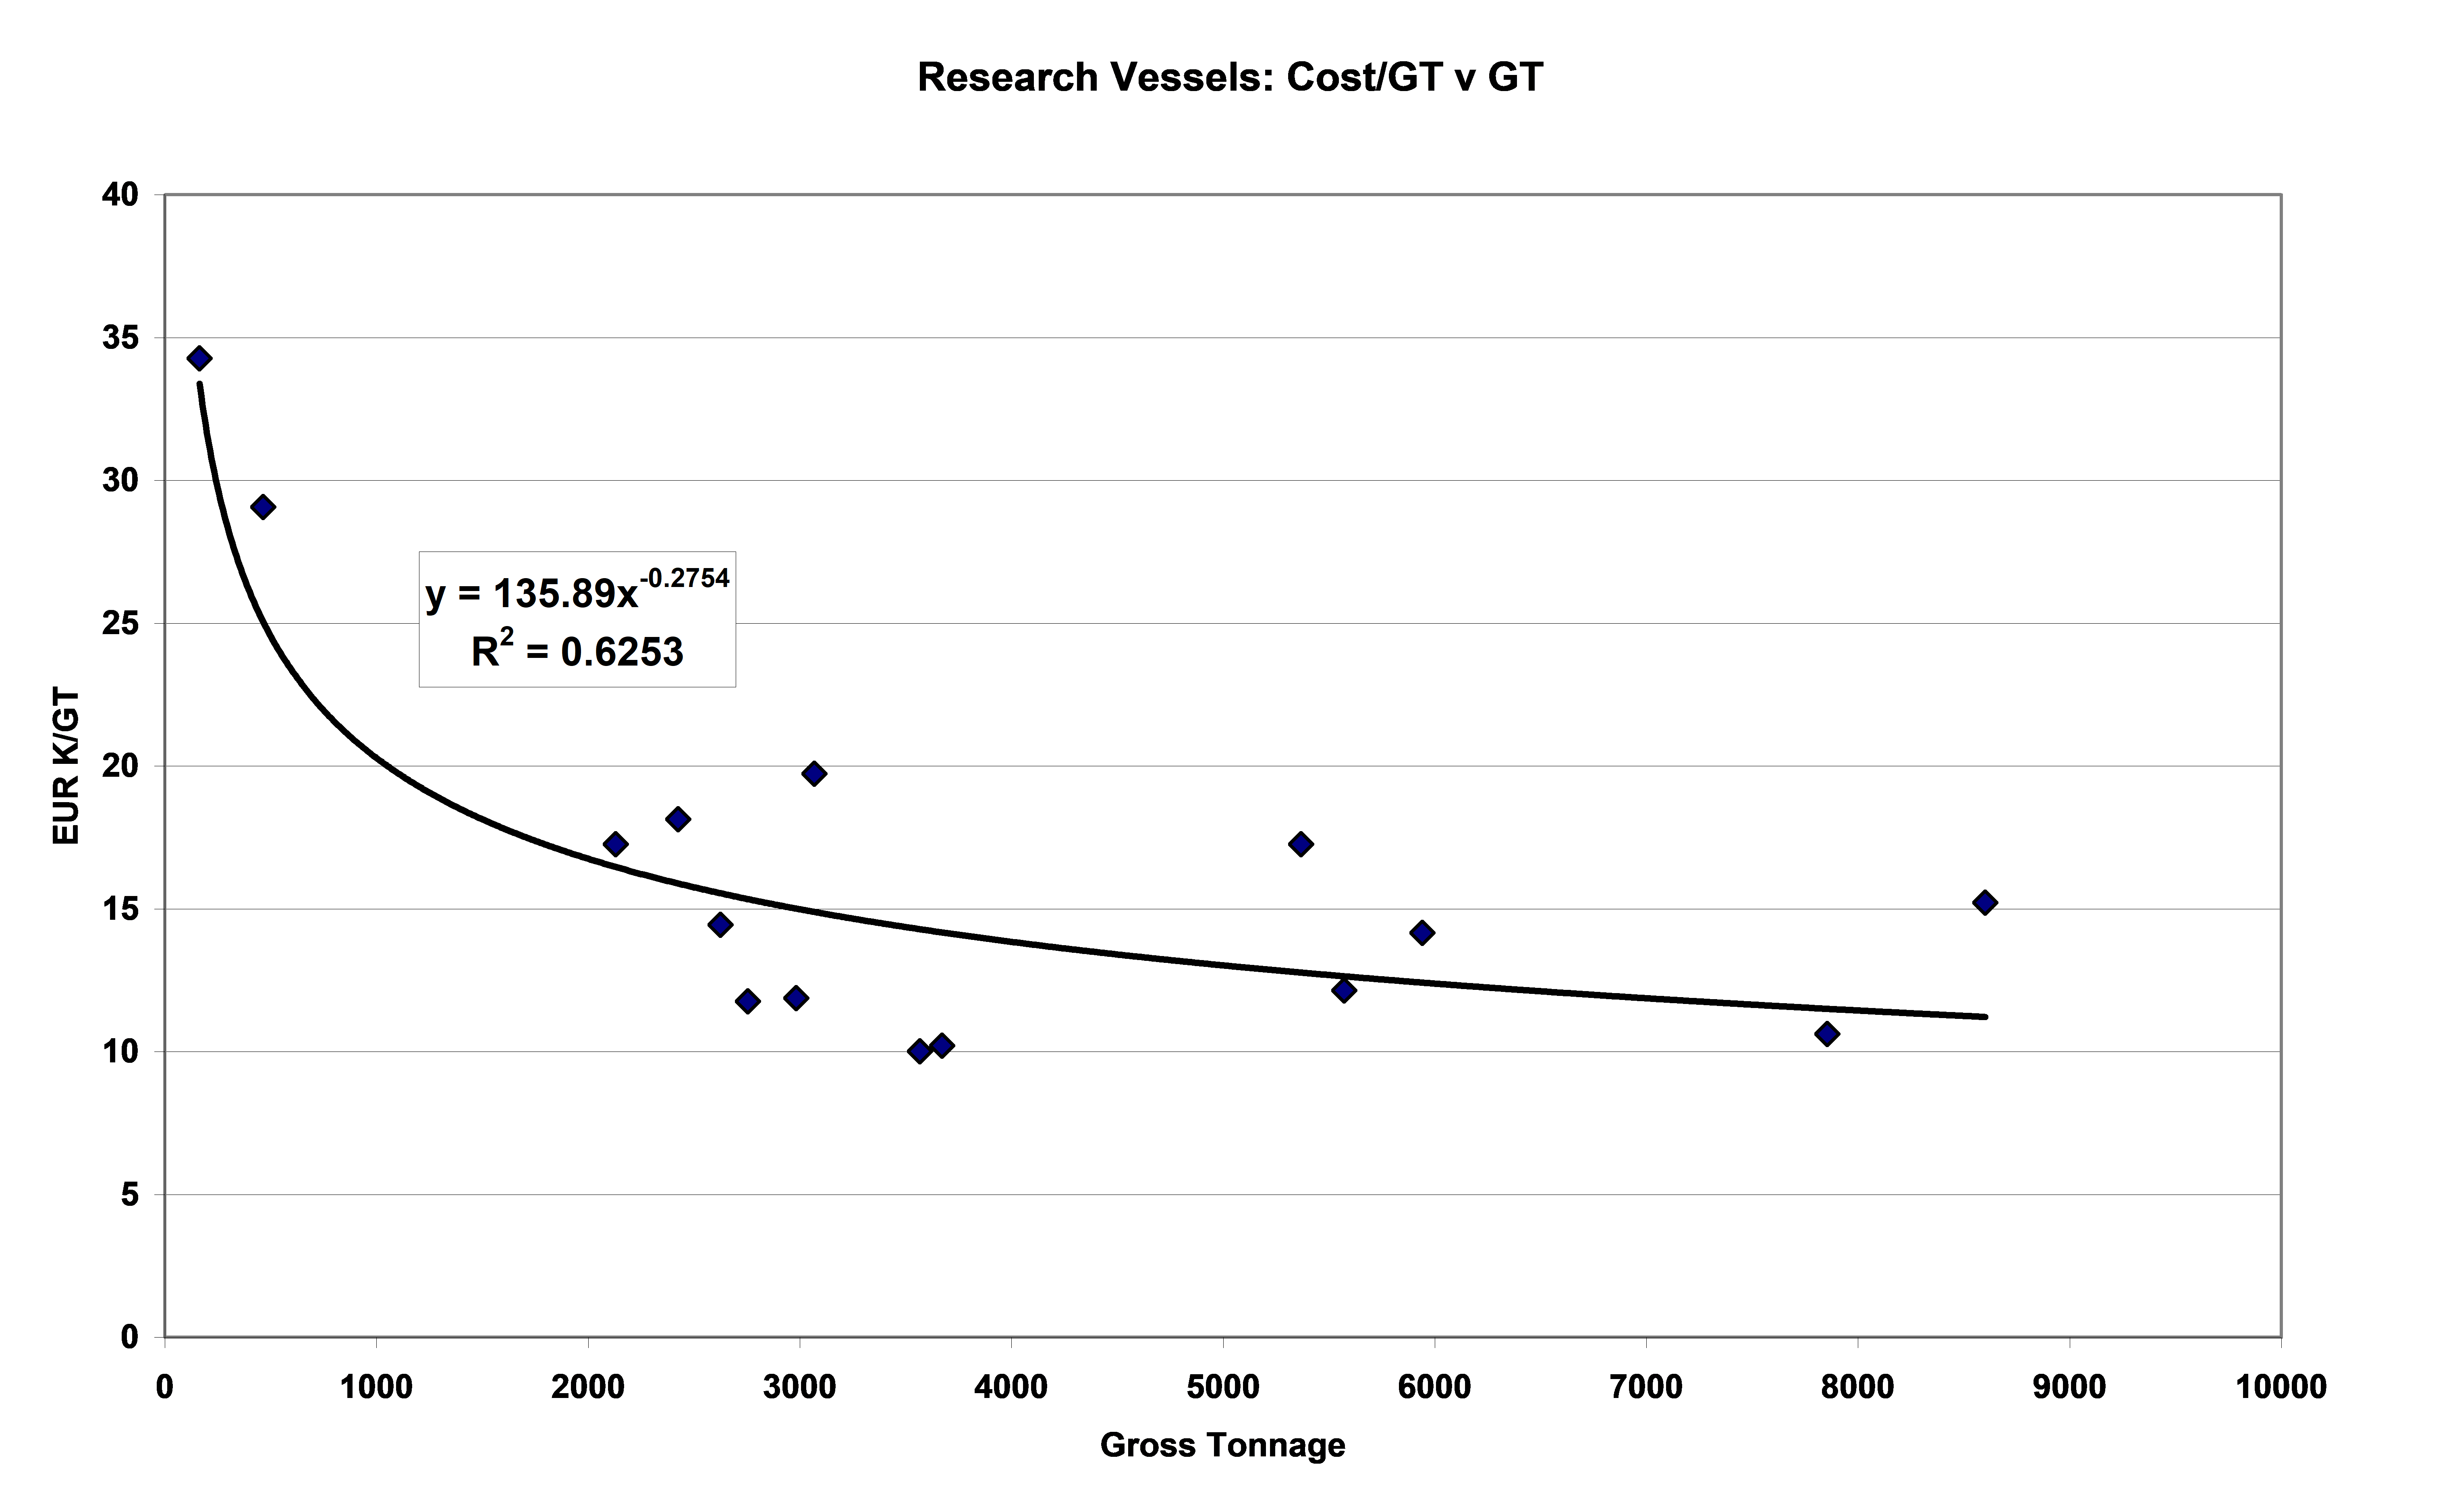
The survey ship data has been maintained and updated for future use. Using only more recent data an analysis has produced Figure 3, demonstrating how size influences the specific cost, and again demonstrating the size exponential to be of the order of 0.7. The degree of scatter is typical for such parametric analysis. One should use Order Date as a second independent variable but this has no marked effect on the exponential Statistically determined confidence bands are significantly wide due to this scatter and the comparatively small amount of data. One published set 1 of typical accuracies is +100%, -50%, this reducing to +30%, -20% with the inclusion of “appropriate contingency” which others might more clearly describe as risk provision.
Figure 3: Research Vessels: Cost/GT v GT
In the defence arena much has been published about the real cost growth of equipments. One lifelong proponent of the need to recognise this influence was Philip Pugh who published the handbook “Defence Equipment Costs” shortly before his death in early 2009. Real cost growth is also evident in other equipments; in the marine arena there are the increasing requirements of the IMO together with increased health and safety requirements and accommodation requirements.
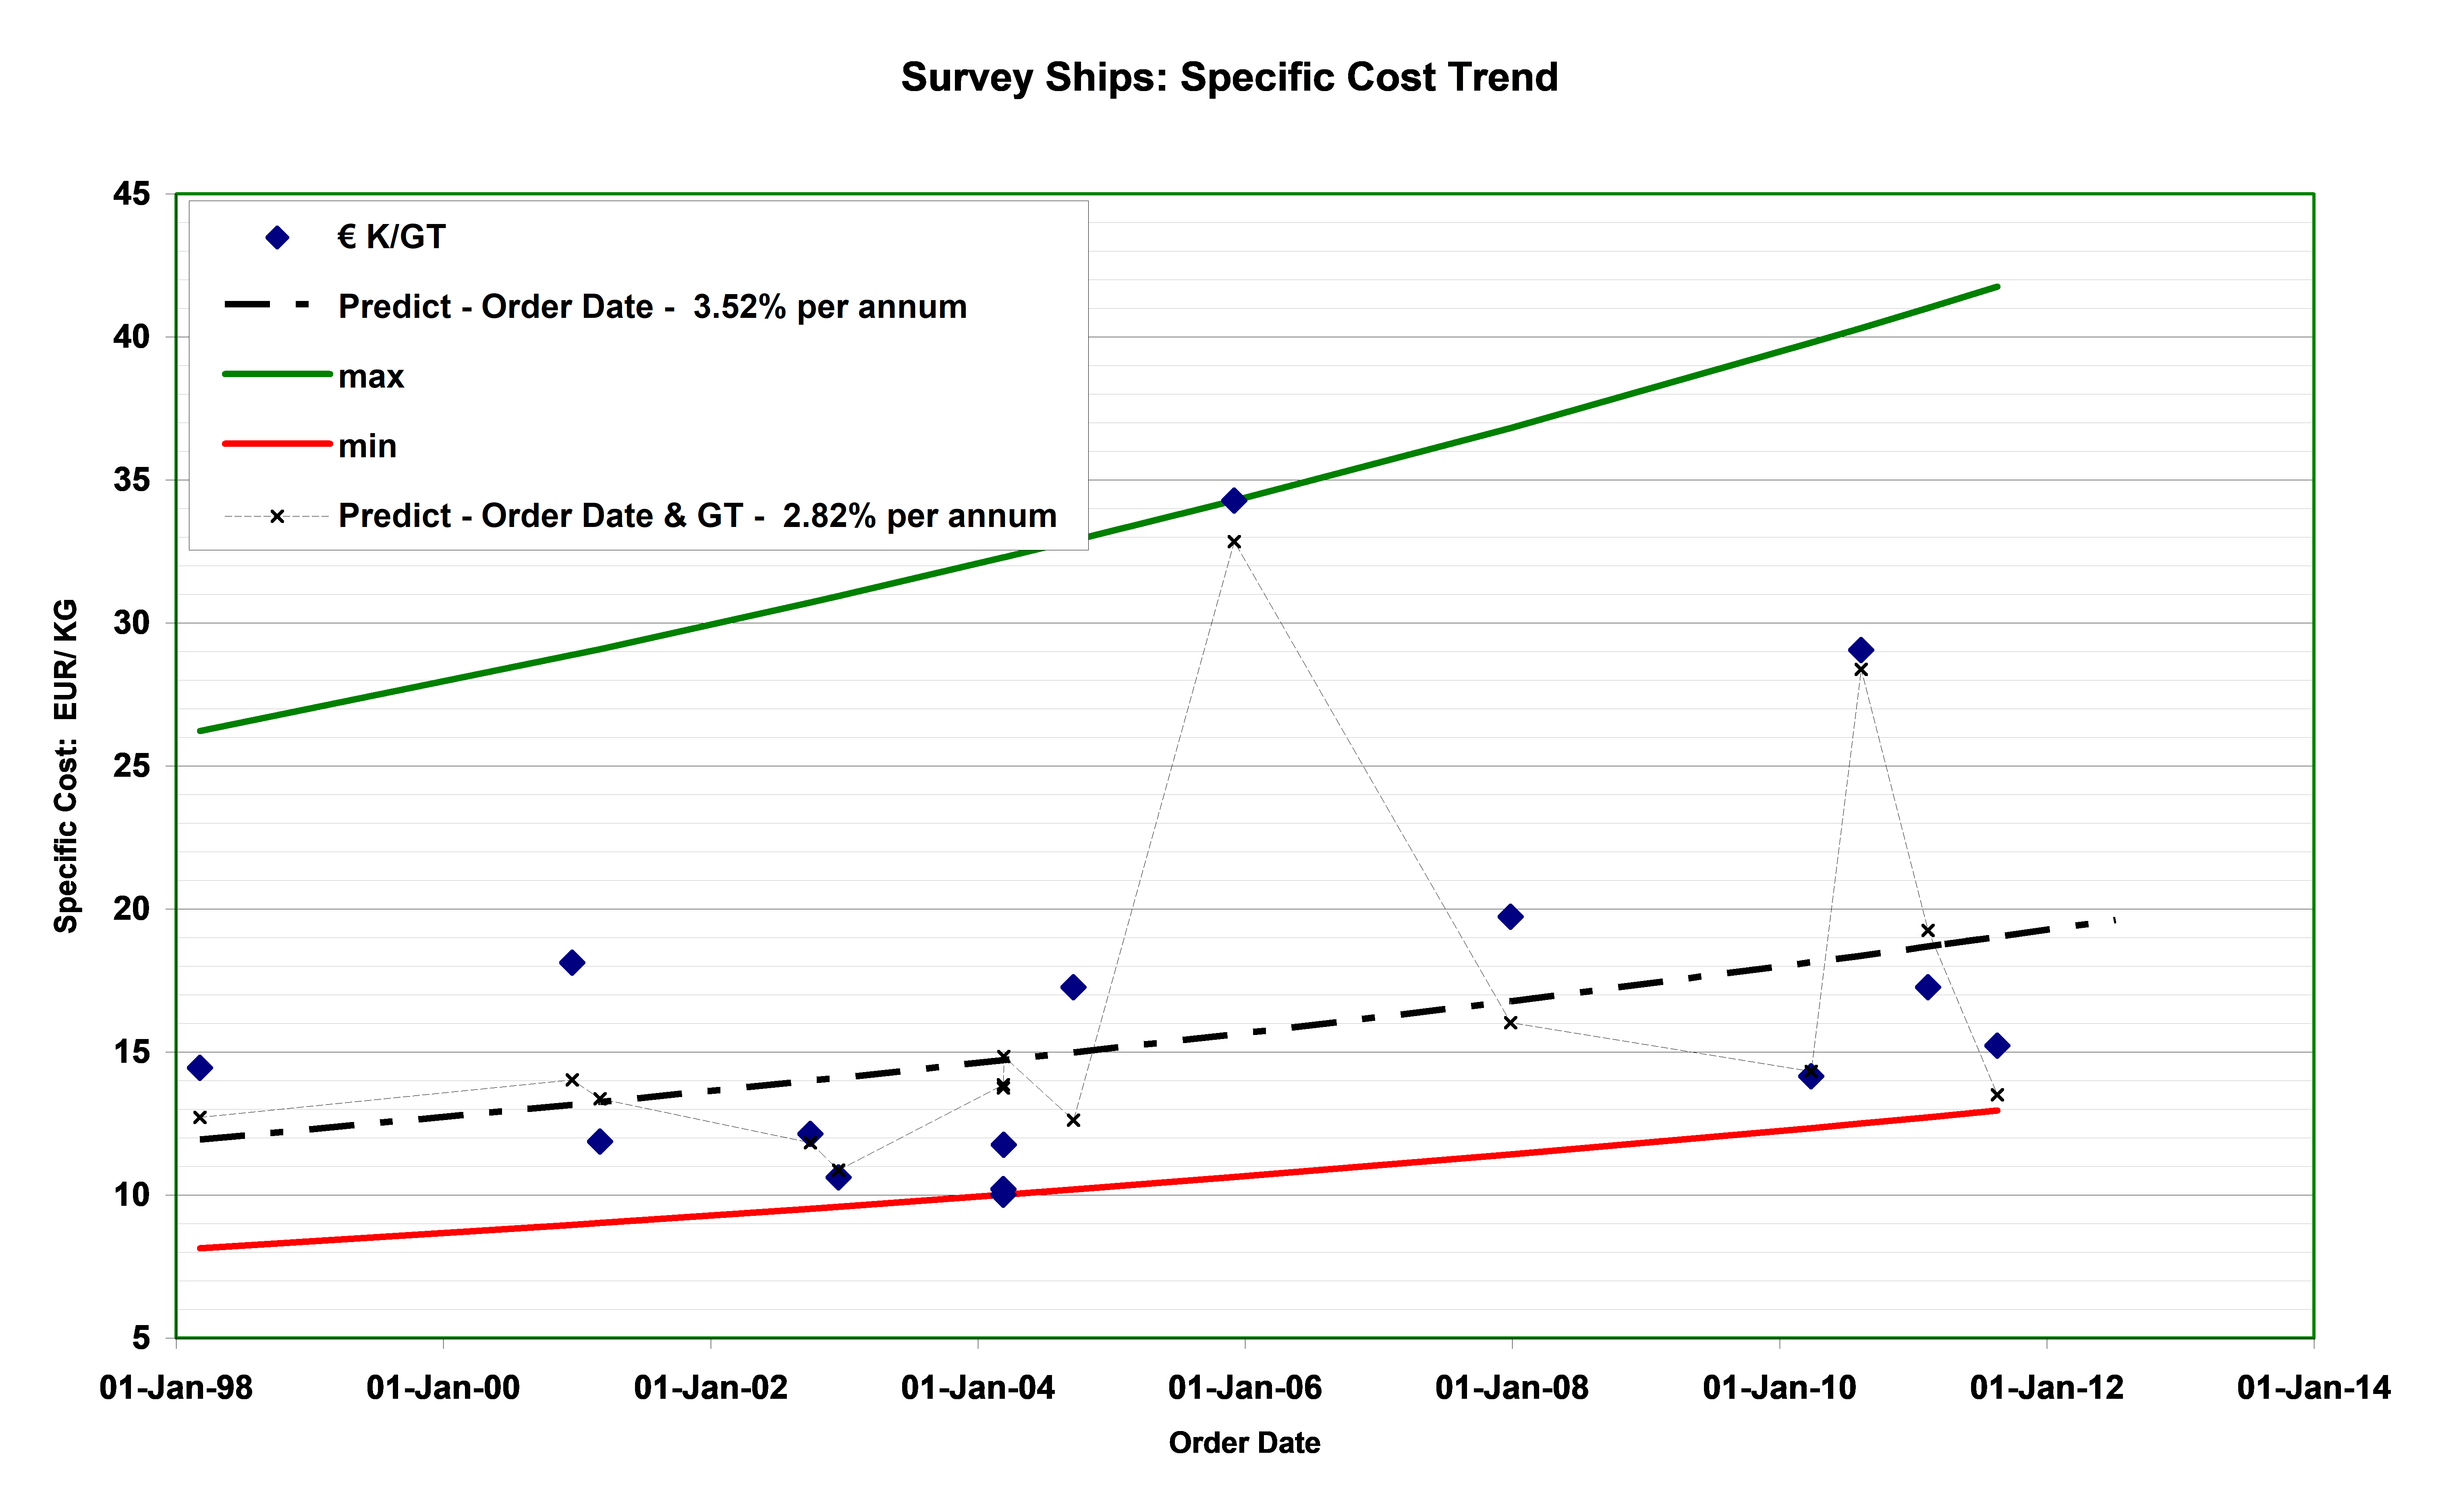
The RAND National Defense Research Institute has published reports on cost growth in naval vessels. Applying the same analysis to the survey ship data produces the result shown in Figure 4. Analysing specific cost with only the order date as an independent variable produces the curves shown with significant data scatter. Introducing the Gross Tonnage as a second independent variable reduces the variation around the regression line to +33%, -25%. The larger specific costs are for vessels significantly smaller than the rest of the data set and therefore of much higher specific cost.
Figure 4: Survey Ships: Specific Cost Trend
Introducing further independent variables to identify facilities such as hangarage produces the plots shown in Figure 5 and reduces the apparent real cost growth factor.
Figure 5: Multi-variable Historical Trend in Specific Cost
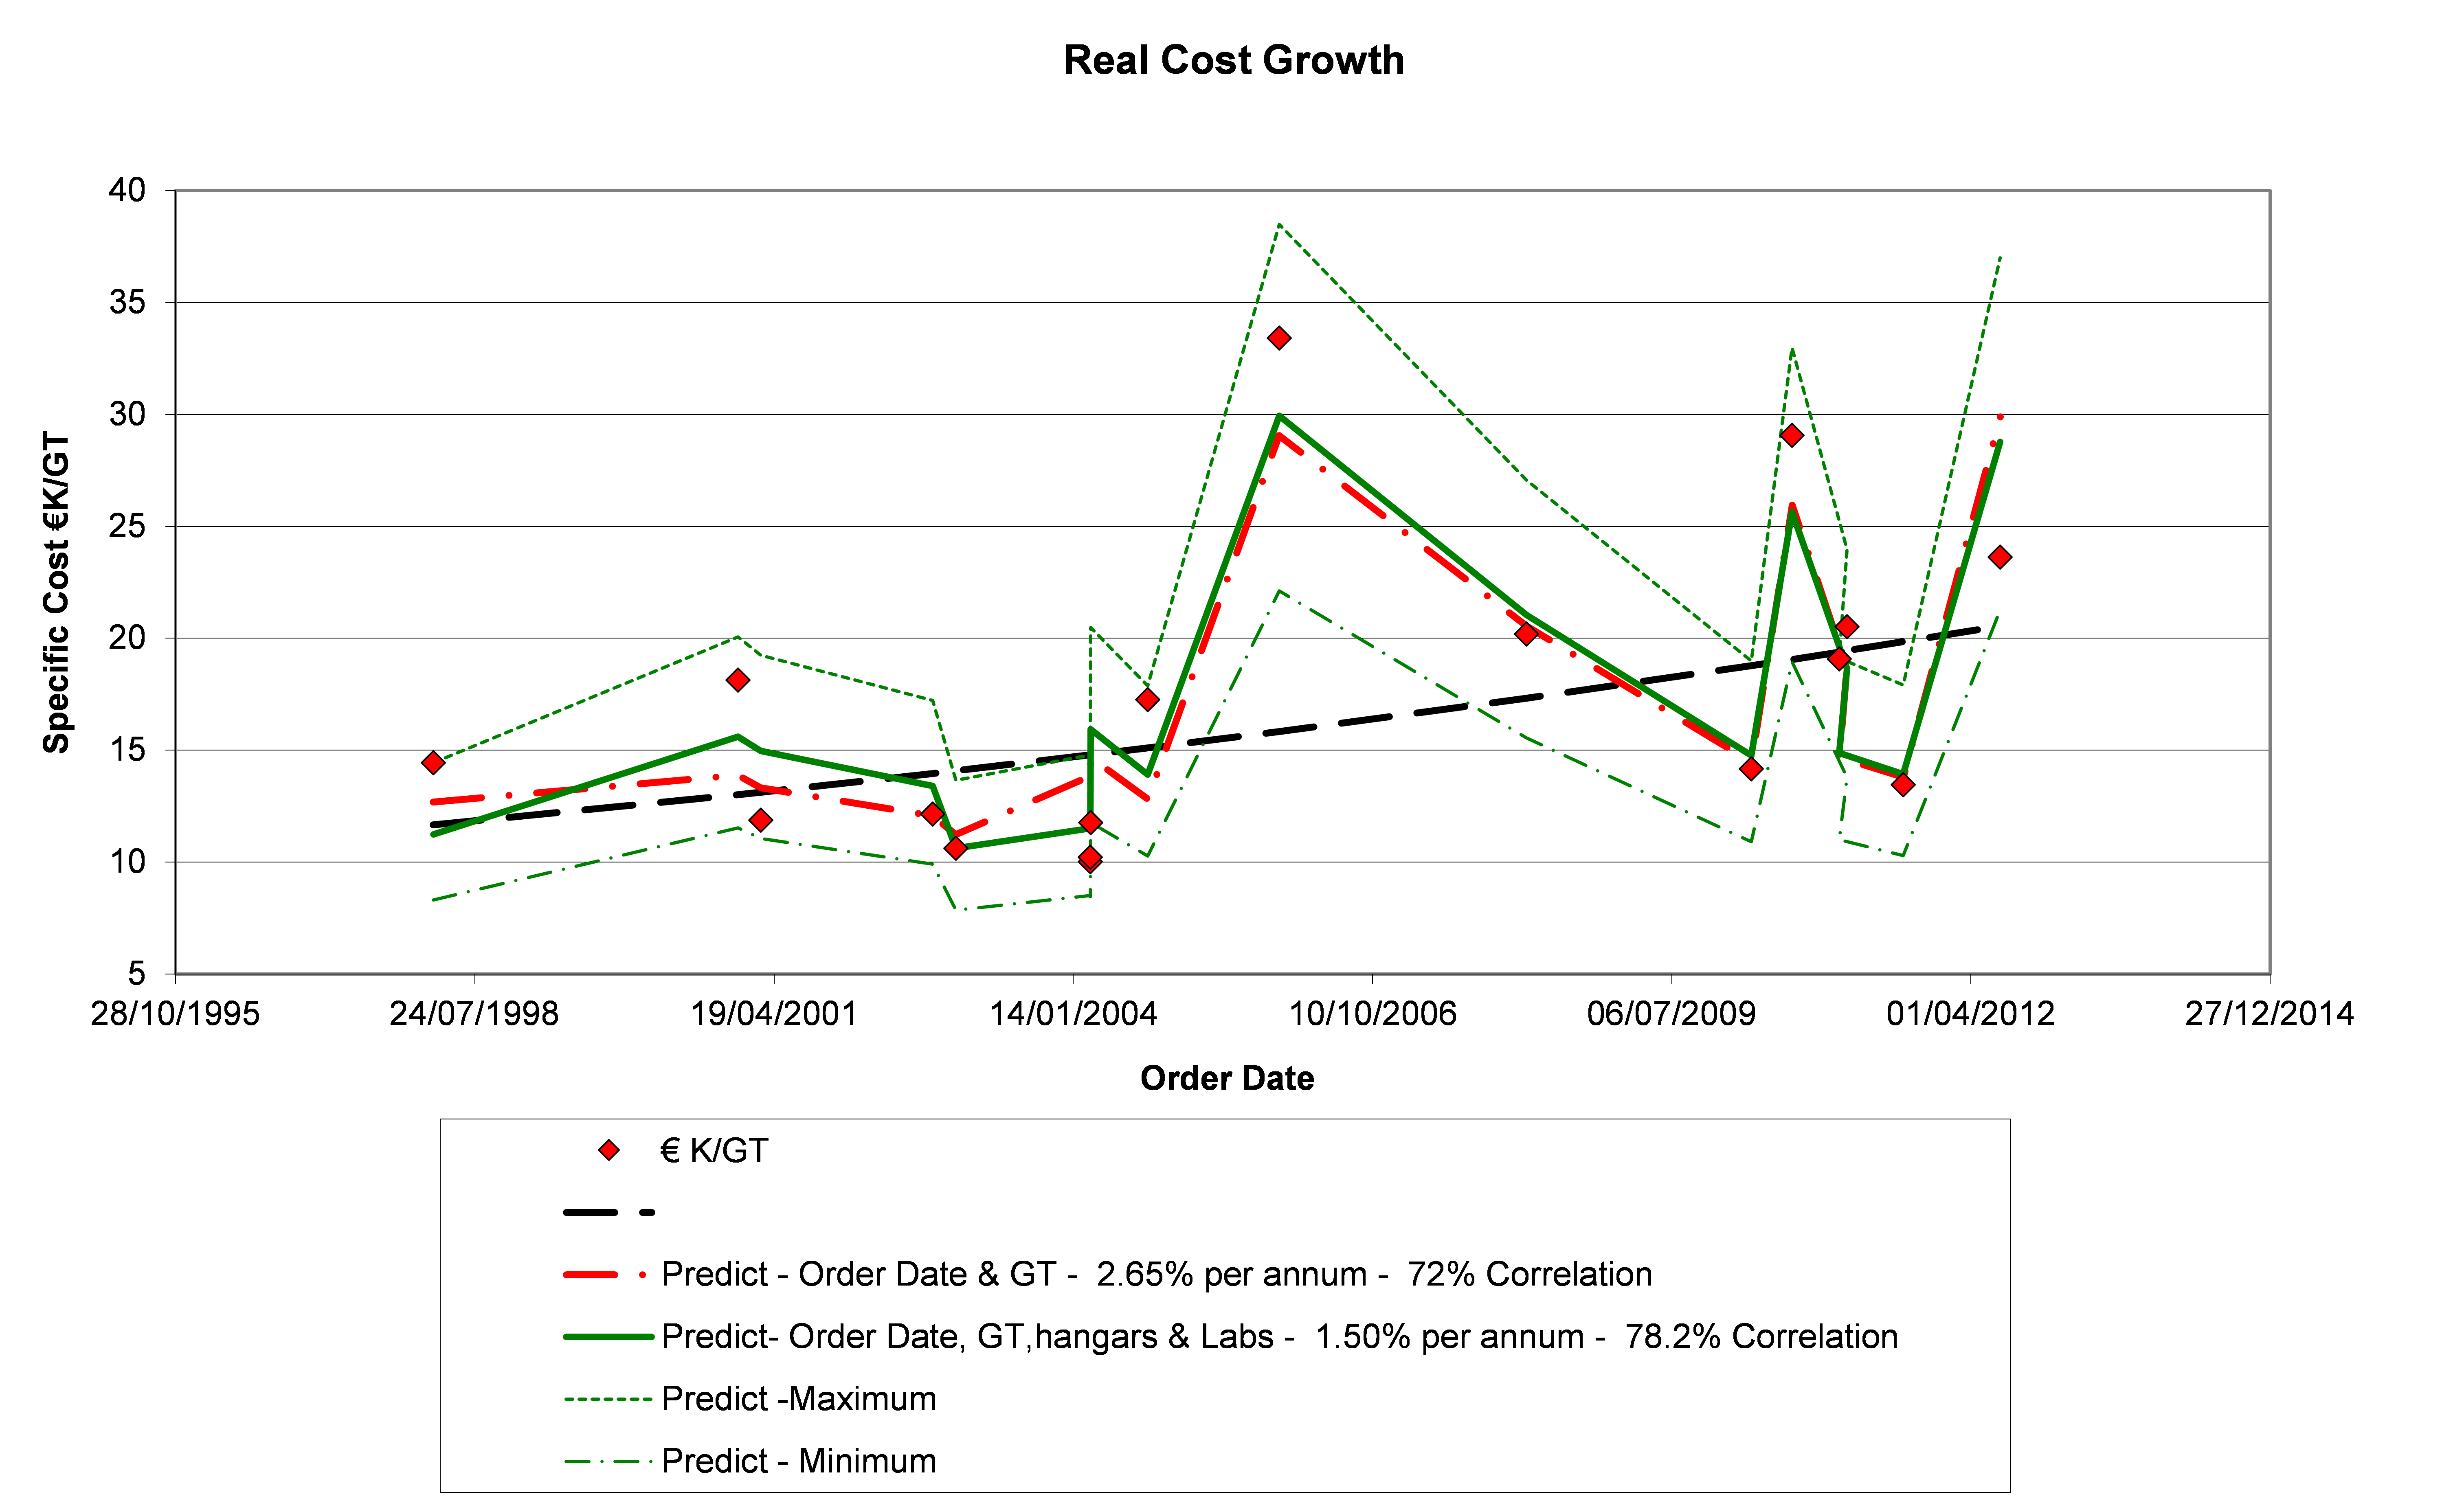
The real cost growth factors identified by this analysis are indicative of the allowance that must be made when formulating the budgets for future research vessels.
Overall, what has been demonstrated is that the cost of research vessels increases less than linearly in proportional to size while for a given size of vessel the specific cost will experience a real cost growth of the order of 2.75% - 3% per annum when based on size alone. Introducing other independent variables reduces the apparent real cost growth to 1.5% - 2% per annum.
1 Association for the Advancement of Cost Engineering (AACE) International Recommended Practice No. 18R-97