Thanks to Brian Tanner for this guest blog
A Historical Trend Analysis is, by definition, the use of historical data the understanding of which can be limited without knowledge, that is, data, be that written records or the musings of people who knew the equipment projects in their much younger days.
One simple example comes from Hansard entries: Auxiliary Oiler Replenishment Vessels...
Auxiliary Oiler Replenishment Vessels
HC Deb 19 January 1995 vol 252 c686W
- Mr. Nicholas Brown: To ask the Secretary of State for Defence what was the total cost to the Exchequer including subsidy and post-acceptance refit costs, of (a) AOR1 and (b) AOR2.
- Mr. Freeman: The total cost to the end of December 1994 to my Department, including post-acceptance rectification work, is £131.1m and £159.4m (actual prices) for AOR 01 and AOR 02 respectively. Final costs for both vessels have still to be agreed. An independent assessment of Harland and Wolff s bid for AOR 01 concluded that the bid contained no element of subsidy. Neither was there any element of subsidy in Swan Hunter's bid for AOR 02. The Northern Ireland Department of Economic Development made payments of £53m to Harland and Wolff as part of the yard's privatisation. These payments were tied to progress in completing AOR 01.
HC Deb 23 May 1995 vol 260 c502W
- Mr. Fatchett
To ask the Secretary of State for Defence if he is now in a position to announce the agreed final costs for AORO1 and AORO2; and if he will make a statement.
- Mr. Freeman
The total cost to the end of April 1995 to my Department is £154.8m and £204.7m, actual prices, for AORO1 and AORO2 respectively. Final costs for both vessels have still to be agreed.
So in the space of four months Parliament is told figures which differ by some 20% and 30% respectively. With some ‘insider’ knowledge, and as given in the text, the first figures are the price in the fixed price contracts while the second set of costs is most probably the total cost of each contract to the MoD, that is, inclusive of inflation payments.
Such variations, if not understood, can lead to incorrect inferences being drawn.
While searching the internet for some information on the real cost growth of defence equipment, the following report resulted:
DEFENCE ECONOMIC RESEARCH PAPER - INTERGENERATIONAL EQUIPMENT COST ESCALATION by N. Davies, A. Eager, M. Maier and L. Penfold
The writings of Philip Pugh and David Kirkpatrick on the subject of Real Cost Growth are well known, so this report was perused with interest, particularly the section relating to frigates and destroyers.
The first half of the following table is a direct copy of Table 1 in the report; the second half is the first half repeated with data from established sources.
Firstly, where did the base data come from? Prior to 1982 all shipbuilding contract costs were reported in the Navy/ Supply Estimates. And what is the price level of those costs? Again with some insider knowledge, comparing Type 22 costs with known contract prices suggests the published figures are outturn. If one were to ask what costs are available in MoD they will be either the contract cost available from contracts department or the total cost paid by the MoD available from the finance department, that is contract price plus payments for inflation
Figure 1: Shipbuilding Contract Real Cost Growth, Reported
| Earliest In-Service Date | Frigate Class | Displacement (Tons) | Unit Cost ('09 ECs) |
| 1956 | Type 14 | 1,456 | £33m |
| 1957 | Type 12 | 2,150 | £62m |
| 1957 | Type 12M | 2,150 | £71m |
| 1959 | Type 81 | 2,300 | £94m |
| 1961 | Leander | 2,500 | £81m |
| 1972 | Type 21 | 2,750 | £192m |
| 1976 | Type 22 | 4,400 | £413m |
| 1989 | Type 23 | 4,800 | £183m |
Figure 2: Shipbuilding Contract Real Cost Growth, Alternative
| Delivery Date | Ship Name |
Navy / Supply Estimates: Shipbuilding Costs |
Shipbuilding Costs ('09 ECs) |
| 1955 | HMS Hardy | £1.4m | £30.4m |
| 1956 | HMS Torquay | £2.7m | £59.5m |
| 1960 | HMS Yarmouth |
£3.5m |
£61.8m |
| 1961 | HMS Ashanti | £5.3m | £91.9m |
| 1963 | HMS Leander | £4.6m | £78.0m |
| 1974 | HMS Amazon | £16.8m | £180.0m |
| 1979 | HMS Boadsword |
£31.3m 1 £68.6m 2 |
£261.4m £392.5m |
| 1989 | HMS Norfolk | £66.8m 3 | £174.2m |
| 2001 | HMS Portland | £85.0m | £122.9m |
For the second half of the table, the costs were normalised to the 2009 price level using the GDP deflator, the index for the original costs being taken as the average over the construction period for each ship. The Type 22 entries demonstrate how informed inferences are essential for the use of historical data.
Over the sample period between Type 14 First of Class (FOC) HMS Hardy and Type 23 First of Class HMS Norfolk the unit cost escalation is 5.3% per annum; on a specific cost basis the cost escalation is 1.87% per annum.
Over the period in which later Type 22s and Type 23 frigates were under construction there was significant change in contract conditions and manufacturing processes. One can assume that, to a first degree of accuracy, the costs for HMS Portland can be a proxy for the first of class built at the end of these conditions. That would result in performances of 3.9% and 0.5% per annum, that is, changes in the shipbuilding industry have countered the increase in ship complexity although this does exclude the inevitable cost growth that will have occurred in the GFE weapon systems.
The analysis of real cost growth is usually done assuming a geometric relationship. If such a relationship is applied to all First of Class frigates since World War II, the specific cost is found to increase at 1.95% per annum. If qualitative factors are introduced to represent more rigorous contract conditions and improved production facilities, and Type 45 specific cost used to represent the most recent class of DD/FF, the underlying real cost growth is 3.6% per annum. Here is the graphic:
Figure 3: Cost per Tonne Trend Line FOC Ships
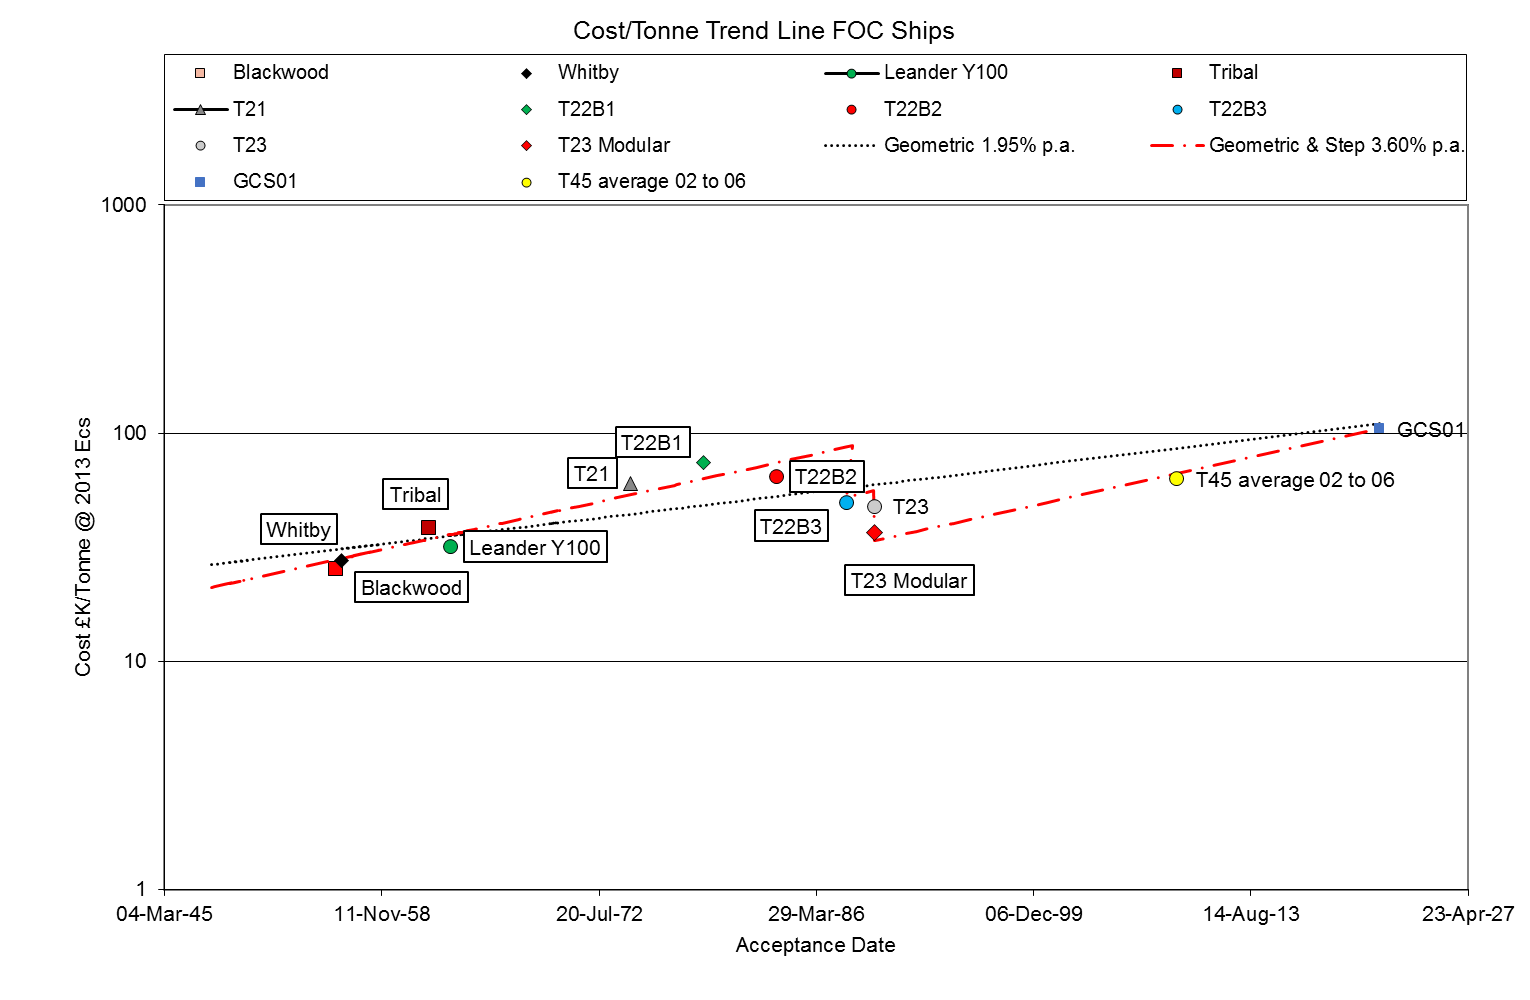
For Type 26 Global Combat Ship the regression lines suggest a Cost per Tonne of £105,000 to £110,000 per tonne. From a size trend line the Full Load Displacement (FLD) of the Type 26 Global Combat Ship will be some 6,250 Tonnes. Using typical Lightship to FLD ratios this suggests a shipbuilding cost of £490m - £515m at 2009 Prices. £530m - £560m at 2013 prices. How close to the truth the estimate is only time will tell, but a rigorous application of regression theory would produce a wide prediction interval due to the small data set.
Referring back to the table there are some observations to be made:
- Where the costs in the report are similar to those of this paper the differences are probably due to the assumption of the original price levels and the normalisation tables used.
- After the cessation of reporting shipbuilding costs in the Navy/ Supply Estimates, the provision of information in response to parliamentary questions may have had a different scope, i.e. unit costs rather than platform costs;
- During the middle of the 1970s when Type 21 and Type 22 frigates were under construction inflation was very high, exceeding 25% in one year. Taking average inflation across any one build period to normalise the costs can be expected to introduce errors.
Perhaps the most important observation is that without good historical data any trend analysis will be subject to uncertainty. Given the frequency of defence equipment deliveries, data collection to the level required for trend analysis should not be an onerous task.
1 Final Contract Price – probably excluding Long Lead Items – from old SPS (CAAS) database
2 Supply Estimate Outturn – probably including Long Lead Items
3 Type 23 data from CAAS data sheet.